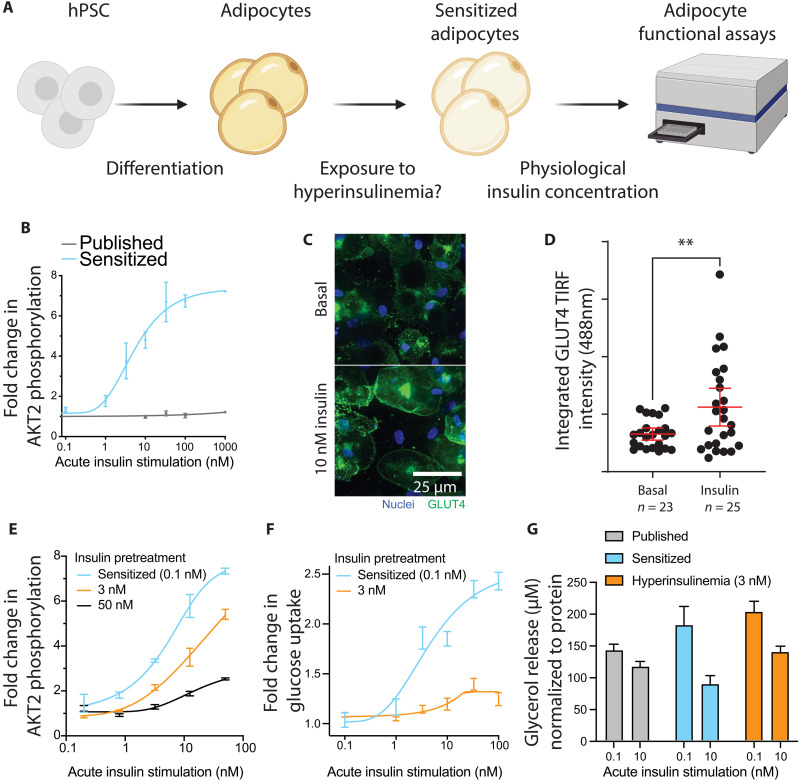
Fig. 2. Physiological insulin levels induce insulin response and resistance.
(A) Schematic indicating the experimental setup to measure insulin dose-response and induction of insulin resistance. (B) Insulin dose-response curve showing fold change in AKT2 phosphorylation compared to the unstimulated state. (C) Representative images of GLUT4 translocation to the cell membrane upon insulin stimulation. (D) TIRF measurement of GLUT4 signal intensity at the adipocyte cell membrane (**P < 0.01, unpaired two-tailed t test). (E) Insulin dose-response curve showing AKT2 phosphorylation fold change in three insulin preexposure conditions. Results are normalized to total AKT2 and plotted as fold change to unstimulated cells in that condition. (F) Insulin dose-response curve showing glucose uptake for sensitized and hyperinsulinemia-exposed adipocytes. Results are normalized to total protein content and plotted as fold change to unstimulated cells. (G) Glycerol release into the medium for published, sensitized, and hyperinsulinemia-exposed adipocytes showing basal or insulin-suppressed lipolysis, normalized to total protein. Bar graphs depict the mean with error bars representing SD, dose-response curves depict a nonlinear fit curve with error bars representing SD, and the scatterplot depicts individual cell values with mean and 95% confidence interval (CI) overlaid; n = 3 biological replicates unless otherwise indicated.

