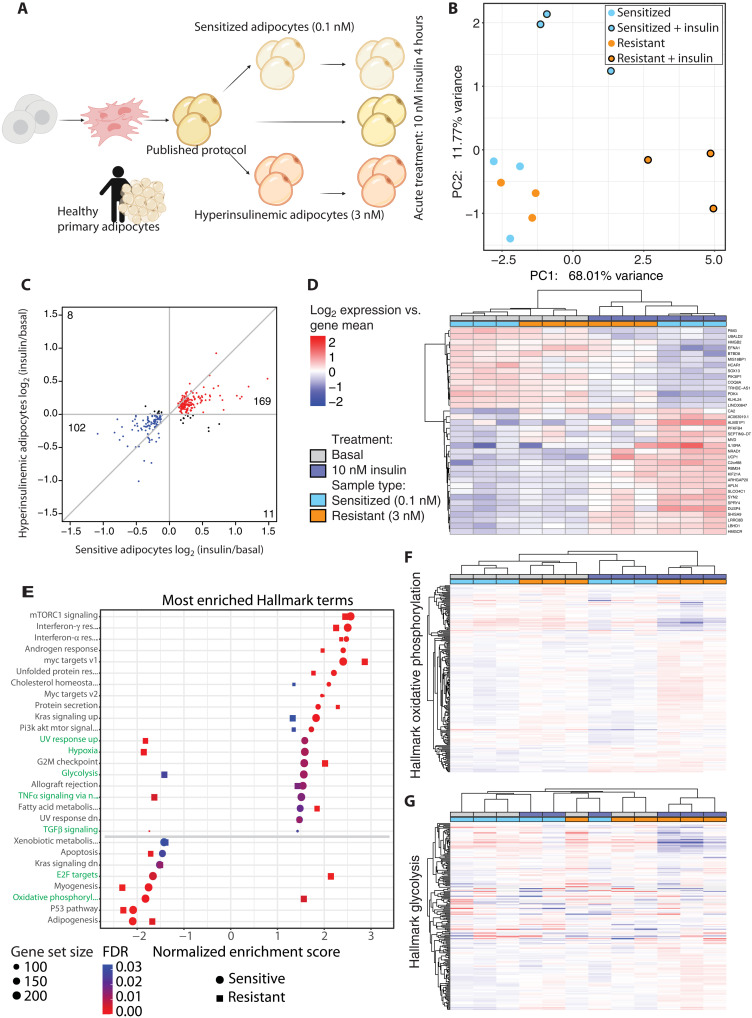
Fig. 3. Induction of insulin resistance perturbs insulin-stimulated transcription.
(A) Schematic indicating the experimental setup for the transcriptomic experiments. (B) PCA plot showing the sensitized and resistant adipocyte in their basal or insulin-stimulated state. (C) Scatterplot comparing fold change in sensitive and resistant adipocytes upon insulin stimulation, filtered on false discovery rate (FDR) ≤ 0.05 in the sensitive adipocytes. Genes with a positive or negative fold change in both comparisons are colored red and blue, respectively, and genes with opposite fold changes appear in black. (D) Heatmap of the genes most changed upon insulin stimulation, filtered by FDR ≤ 0.05 and log2 fold change > 0.5 in the sensitive adipocytes. (E) GSEA results of Hallmark terms that are enriched upon insulin stimulation in both sensitive and resistant adipocytes. Ranked by normalized enrichment score (NES) in the sensitive adipocytes. (F) Heatmap of expression of genes in the oxidative phosphorylation Hallmark gene set. (G) Heatmap of expression of genes in the glycolysis Hallmark gene set. (D), (F), and (G) use the same legend.

