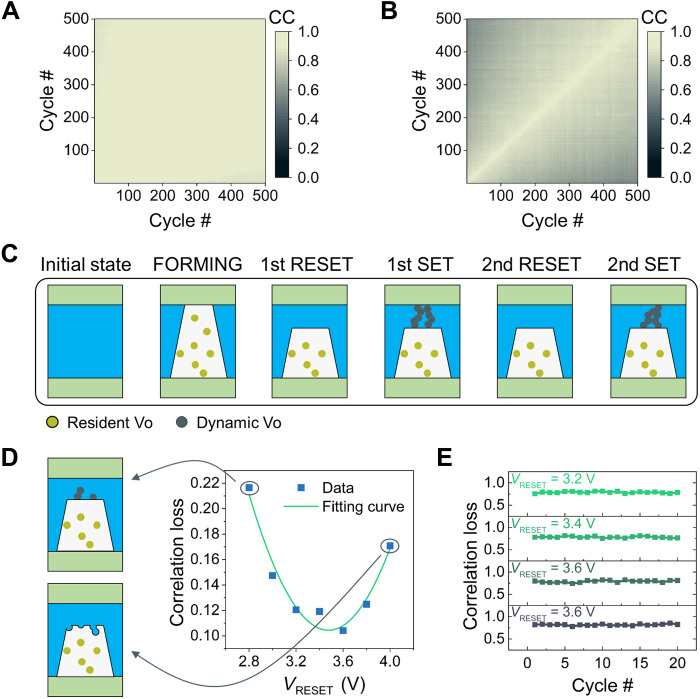
Fig. 3. Correlated filamentary switching characteristics.
(A) The CC matrix of the resistance distribution measured after RESET between cycles. (B) The correlation matrix of the resistance distribution measured after SET between cycles. A CC higher than 0.8, which means a strong correlation, is shown in white, and the color gradually fades to black as the CC decreases. (C) Illustration of the proposed model to explain the correlated filamentary switching found in the HfOx-based memristor. The resident Vo (yellow dots) form the foundation of CF (white background), which is insensitive to soft SET and RESET operations, while the dynamic Vo (gray dots) in the gap can be iteratively erased and generated with the same SET/RESET voltage. (D) The estimated correlation loss between the original resistance distribution (after the first RESET) and the distribution measured after the 21st RESET. The experiment is implemented with variable RESET voltage and SET voltage fixed at 2.2 V. The large correlation loss found at low and high RESET voltages can be explained by the proposed model as under-RESET (top left inset) and over-RESET (bottom left inset), respectively. (E) The change in estimated correlation loss between the original resistance distribution and the distribution measured after SET in different cycles.

