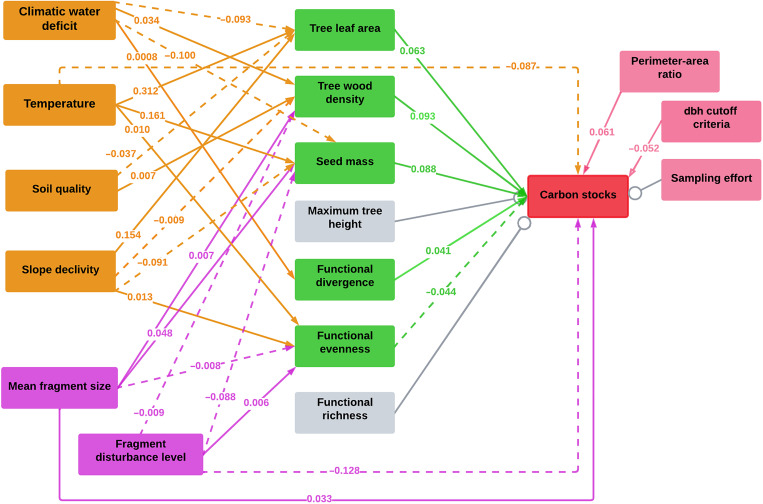
Fig. 4. Causal mediation analysis describing the direct and indirect effects of multiple drivers on the carbon stocks (n = 892).
Solid lines indicate positive significant effects (P < 0.05), whereas dotted lines indicate negative significant effects (P < 0.05). Environmental conditions with significant effects are indicated in orange, human impacts in purple, tree community properties in green, and field sampling methodology aspects in pink. Variables with nonsignificant effects on carbon stocks are indicated in gray. All model estimates are presented in table S4.

