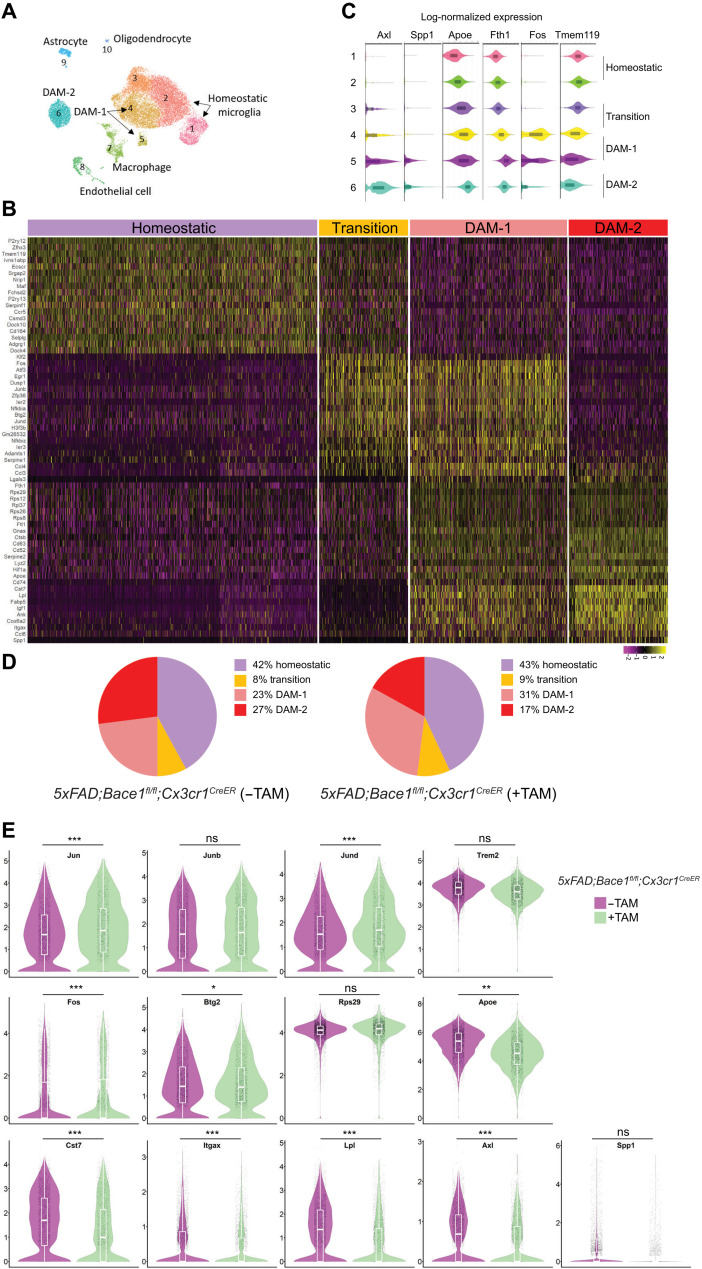
Fig. 1. Bace-1 deletion facilitates microglial transition from a homeostatic to a DAM-like state.
(A) Uniform manifold approximation and projection (UMAP) clustering of CD11b-positive immune-sorted microglia derived from 4-month-old 5xFAD;Bace-1flfl; Cx3cr1CreER with and without TAM for 5 days at 3 months of age, N = 3 each genotype. (B) Heatmap showing unbiased top markers defining each microglia subtype. The color scale represents Z-score–transformed expression values (with yellow and purple representing up-regulated and down-regulated genes, respectively, compared with the mean expression value of a gene from all samples). Four distinct microglial cell populations represent homeostatic, transition, DAM-1–, and DAM-2–like states. (C) Violin plots showing selected genes associated with the homeostatic state and DAM-related microglial genes. On the basis of specific subsets of genes, subclusters 1 to 6 were composed of microglial cells. Tmem119 is concentrated in clusters 1 and 2 and lowered when transited to DAM-1 and DAM-2. Fos is the highest in transitory to DAM-1, while Axl is the highest in DAM-2. (D) Pie chart showing the percentages of microglia within homeostatic, transition, DAM-1, or DAM-2 cluster genes under the 5xFAD condition with and without conditional Bace-1 deletion in microglia [5xFAD;Bace-1fl/fl;Cx3cr1CreER mice (−TAM) versus 5xFAD;Bace-1fl/fl;Cx3cr1CreER mice (+TAM)]. (E) Violin plots compare the distribution of log-transformed normalized gene expression of transcriptions factors and genes strongly expressed in DAM-1 or DAM-2 in the 5xFAD mice with and without conditional microglial Bace-1 deletion. There was significant up-regulation of the AP-1 TF genes Jun, Junb, Jund, and Fos in Bace-1–deleted 5xFAD mice. ns, not significant.

