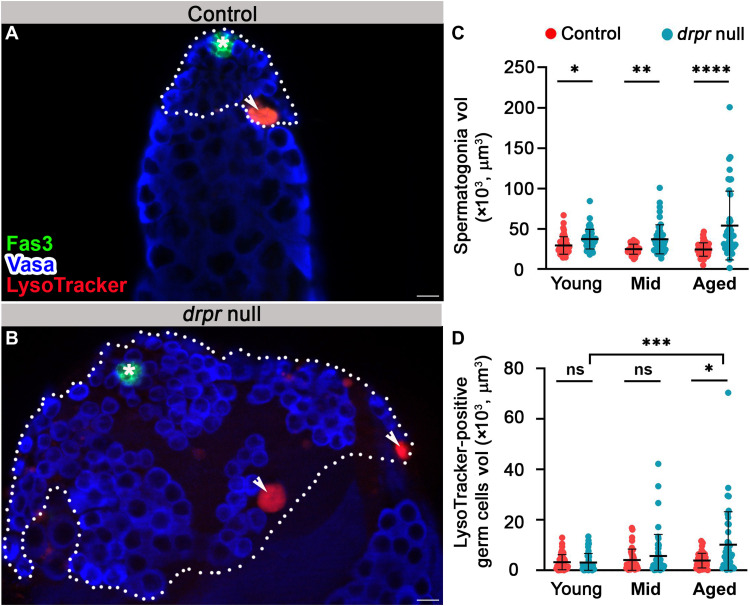
Fig. 7. Hyperplasia of progenitor germ cells and attenuated degradation in testes of drpr-null males.
(A and B) Representative images of the apical tip of testes from 7-day-old males of control [(A) w1118] and drpr-null flies (B). Testes were immunostained for Fas3 (green, hub), Vasa (blue, germ cells), and LysoTracker (red, dying germ cells). The white dashed line delineates spermatogonia cells. Asterisks mark the hub, arrowheads mark LysoTracker-positive germ cells, and scale bars correspond to 10 μm. (C and D) Quantification of the volume of live spermatogonia cells (C) and LysoTracker-positive germ cells (D) as measured with Imaris in control (red dots, w1118) and drpr null (blue dots). Young: control (n = 48) and drpr null (n = 49); mid-aged: control (n = 42) and drpr null (n = 48); and aged: control (n = 47) and drpr null (n = 41). Note the age-dependent increases in hyperplasia and volume of germ cell debris only in drpr null samples. Statistical significance was determined by a Kruskal-Wallis test; *P ≤ 0.05, **P ≤ 0.01, ***P ≤ 0.001, and ****P ≤ 0.0001; ns, not significant.

