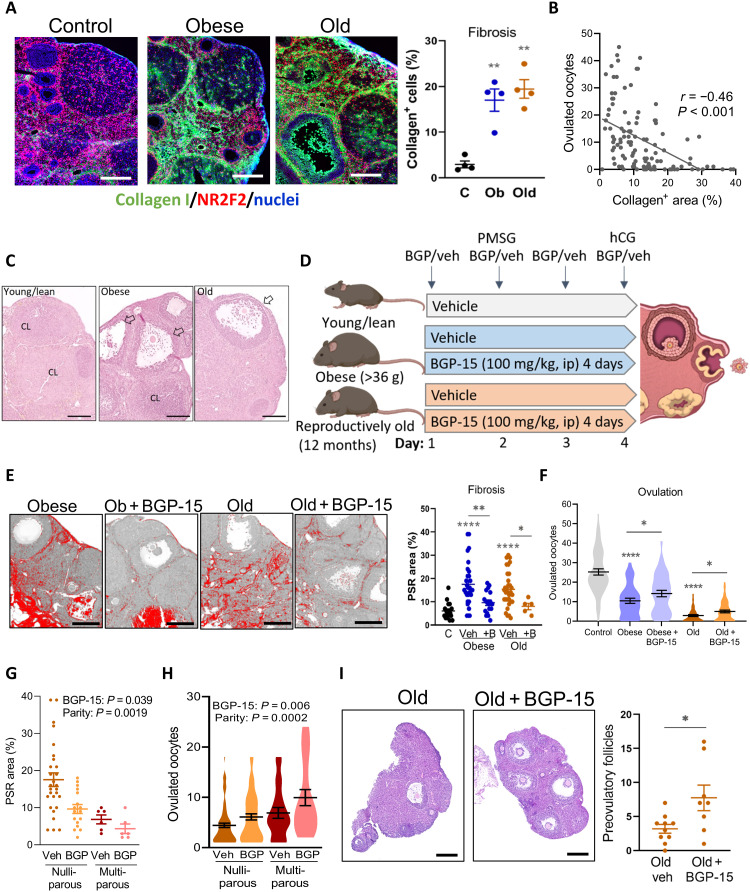
Fig. 4. Obesity and aging cause ovarian fibrosis correlated with ovulation failure, which is mitigated by BGP-15 treatment.
(A) Left: Collagen localization in ovarian stroma of control (C), obese (Ob), and old mice using anti–collagen type I antibody (green) and anti-NR2F2 antibody (red). Scale bars, 200 μm. Right: Percentage of green (collagen) signal/ovarian stromal area. Means ± SEM of n = 4 ovaries (from four mice) per group. (B) Correlation (Pearson’s test) between fibrosis area and ovulation number in control, obese, and old mice; n = 111. (C) Representative hematoxylin and eosin histology showing corpora lutea (CL) and ovulatory yet unruptured follicles (arrows). Scale bars, 200 μm. (D) Experimental groups and treatments. (E) Representative PSR-stained ovarian sections. Scale bars, 200 μm. Fibrosis area quantified (right). Means ± SEM of ovaries from n = 5 to 32 mice per group. (F) Ovulation in young lean controls (n = 53), obese mice treated with saline vehicle (n = 39) or BGP-15 (n = 38), and old mice treated with vehicle (n = 54) or BGP-15 (n = 57). Means ± SEM shown within violin plot. (G) Collagen content (PSR stain) in ovaries from old mice that were nulliparous (n = 17 or 21) or multiparous (n = 6 each vehicle-treated and BGP-15–treated mice) and (H) ovulation in the same types of mice (n = 20 to 79 per group). Effects of parity and BGP-15 identified by two-way ANOVA. (I) Representative ovarian sections of old mice that did not ovulate and number of large preovulatory follicles (right). *P < 0.05, **P < 0.01, and ****P < 0.0001 by one-way ANOVA compared to controls or by two-tailed t test compared to vehicle-treated mice, as indicated. Scale bars, 200 μm.

