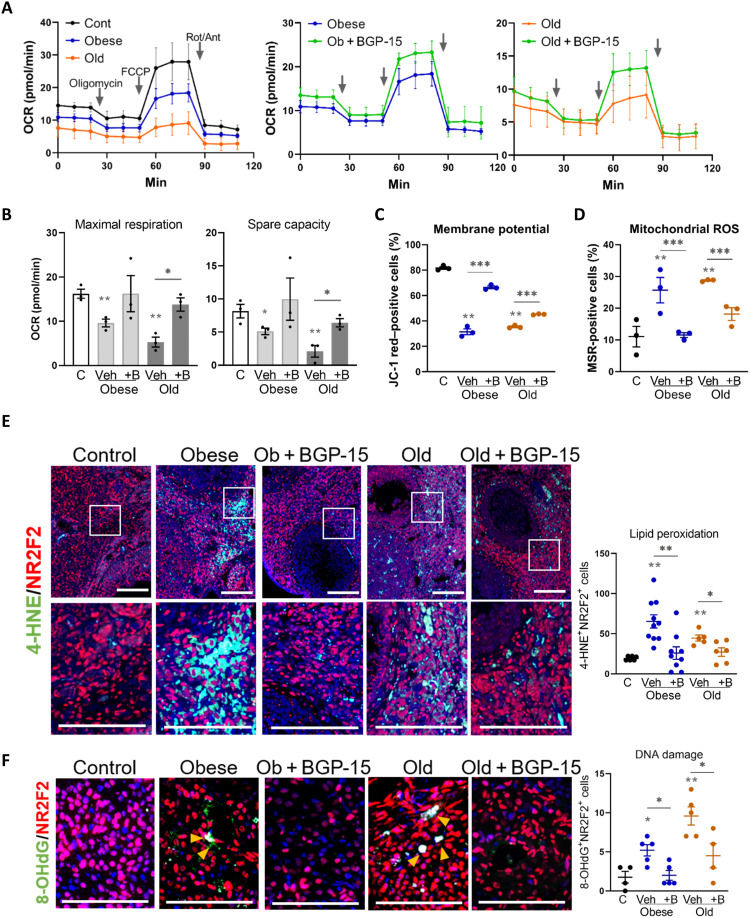
Fig. 6. Mitochondrial dysfunction and oxidative stress in ovarian stroma with obesity or aging are recovered by BGP-15.
(A) Kinetics of oxygen consumption rate (OCR) in ovarian stromal cells from control mice or those that are obese or old and compared to those from mice treated with BGP-15 using the Seahorse XF Analyzer. Values represent means ± SEM of n = 3 experimental replicates, each using four to six wells containing cells pooled from three to five mice. (B) Maximal respiration and spare capacity calculated from OCR of ovarian stromal cells from control (C), obese, and old mice with/without BGP-15 (+B) treatment. (C) Percent of JC-1 red–positive (high mitochondrial membrane potential) ovarian stroma cells from control, obese, and old mice with/without BGP-15 treatment. (D) Percent of MitoSOX Red–positive ovarian stroma cells from control, obese, and old mice with/without BGP-15 treatment. (C and D) n = 3 replicates of cells pooled from four to six animals each and analyzed by flow cytometry. (E) Localization of oxidized lipid marker 4-HNE (green) in the ovarian stroma of obese and old mice treated with BGP-15 (or vehicle), colocalized with anti-NR2F2 stromal cell marker (red). The boxed area is shown in the bottom panel. Scale bars, 100 μm. Number of 4-HNE and NR2F2 double-positive cells in the ovarian stromal area (right). n = 5 to 10 mice per group. (F) Localization of oxidized DNA marker 8-OHdG (green) in the ovarian stroma of obese and old mice treated with BGP-15 (or vehicle), colocalized with anti-NR2F2 stromal cell marker (red). 8-OHdG and NR2F2 double-positive cells in the ovarian stromal area (right). n = 4 to 5 mice per group. (B to F) *P < 0.05, **P < 0.01, and ***P < 0.001 by one-way ANOVA compared to controls or by two-tailed t test between BGP-15–treated and vehicle-treated mice as indicated.

