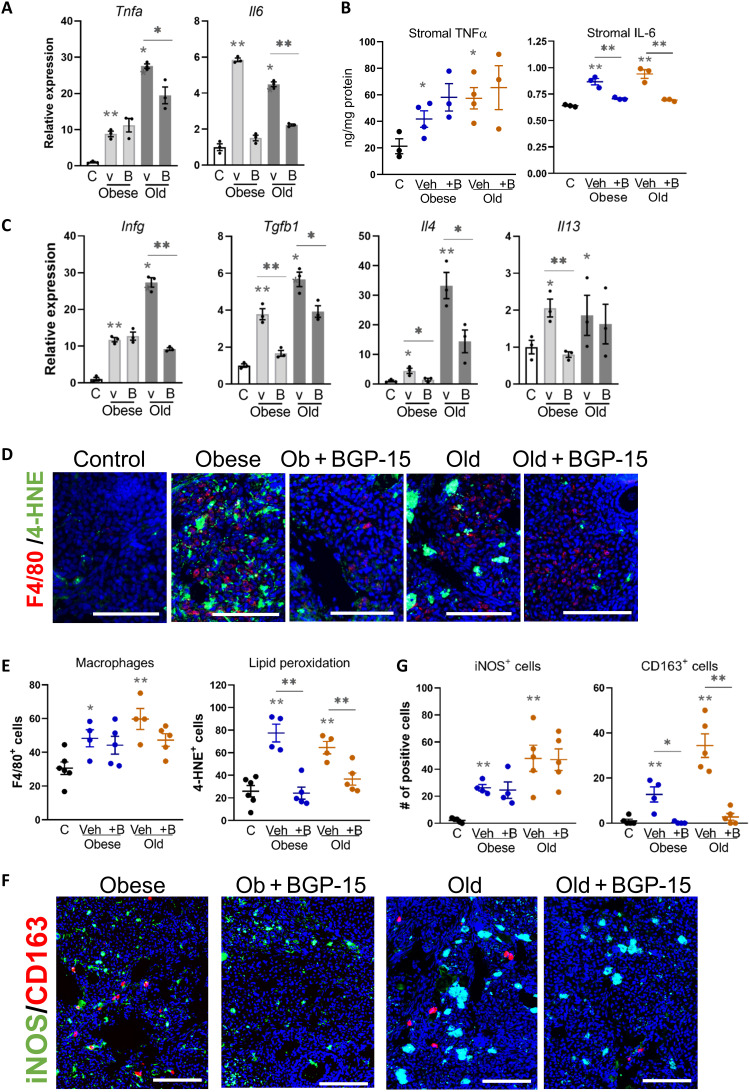
Fig. 7. M1 and M2 inflammation are evident in ovarian stroma with obesity and aging, with M2 macrophage phenotype reduced in BGP-15–treated mice.
(A) Gene expression of inflammatory cytokines (Tnfa and Il6) in ovarian stromal cells of control (C), obese, and old mice treated with BGP-15 (B) or vehicle (v). Expression was normalized to L19 and was presented relative to controls. Values represent means ± SEM of n = 3 replicate pools of stromal cells from multiple mice. (B) TNFα and IL-6 (normalized to total protein) in ovarian stromal cells. Values represent means ± SEM of n = 3 to 4 replicate samples of material pooled from multiple mice. (C) Gene expression of Ifng and anti-inflammatory cytokines (Tgfb1, Il4, and Il13) in ovarian stromal cells from (A). (D) Localization of macrophages in the ovarian stroma using anti-F4/80 antibody (red; macrophages) and anti–4-HNE antibody (green; lipid peroxidation). Scale bars, 100 μm. (E) Numbers of F4/80+ (left) or 4-HNE+ (right) cells in the ovarian stroma. (F) Localization of iNOS (marker of M1 macrophage; green) and CD163 (marker of M2 macrophage; red) in ovarian stroma by immunohistochemistry. Scale bars, 100 μm. (G) Number of iNOS+ or CD163+ cells within the area of ovarian stroma. *P < 0.05 and **P < 0.01 by one-way ANOVA compared with controls or by two-tailed t test compared to vehicle-treated mice as indicated.

