
Fig. 1.
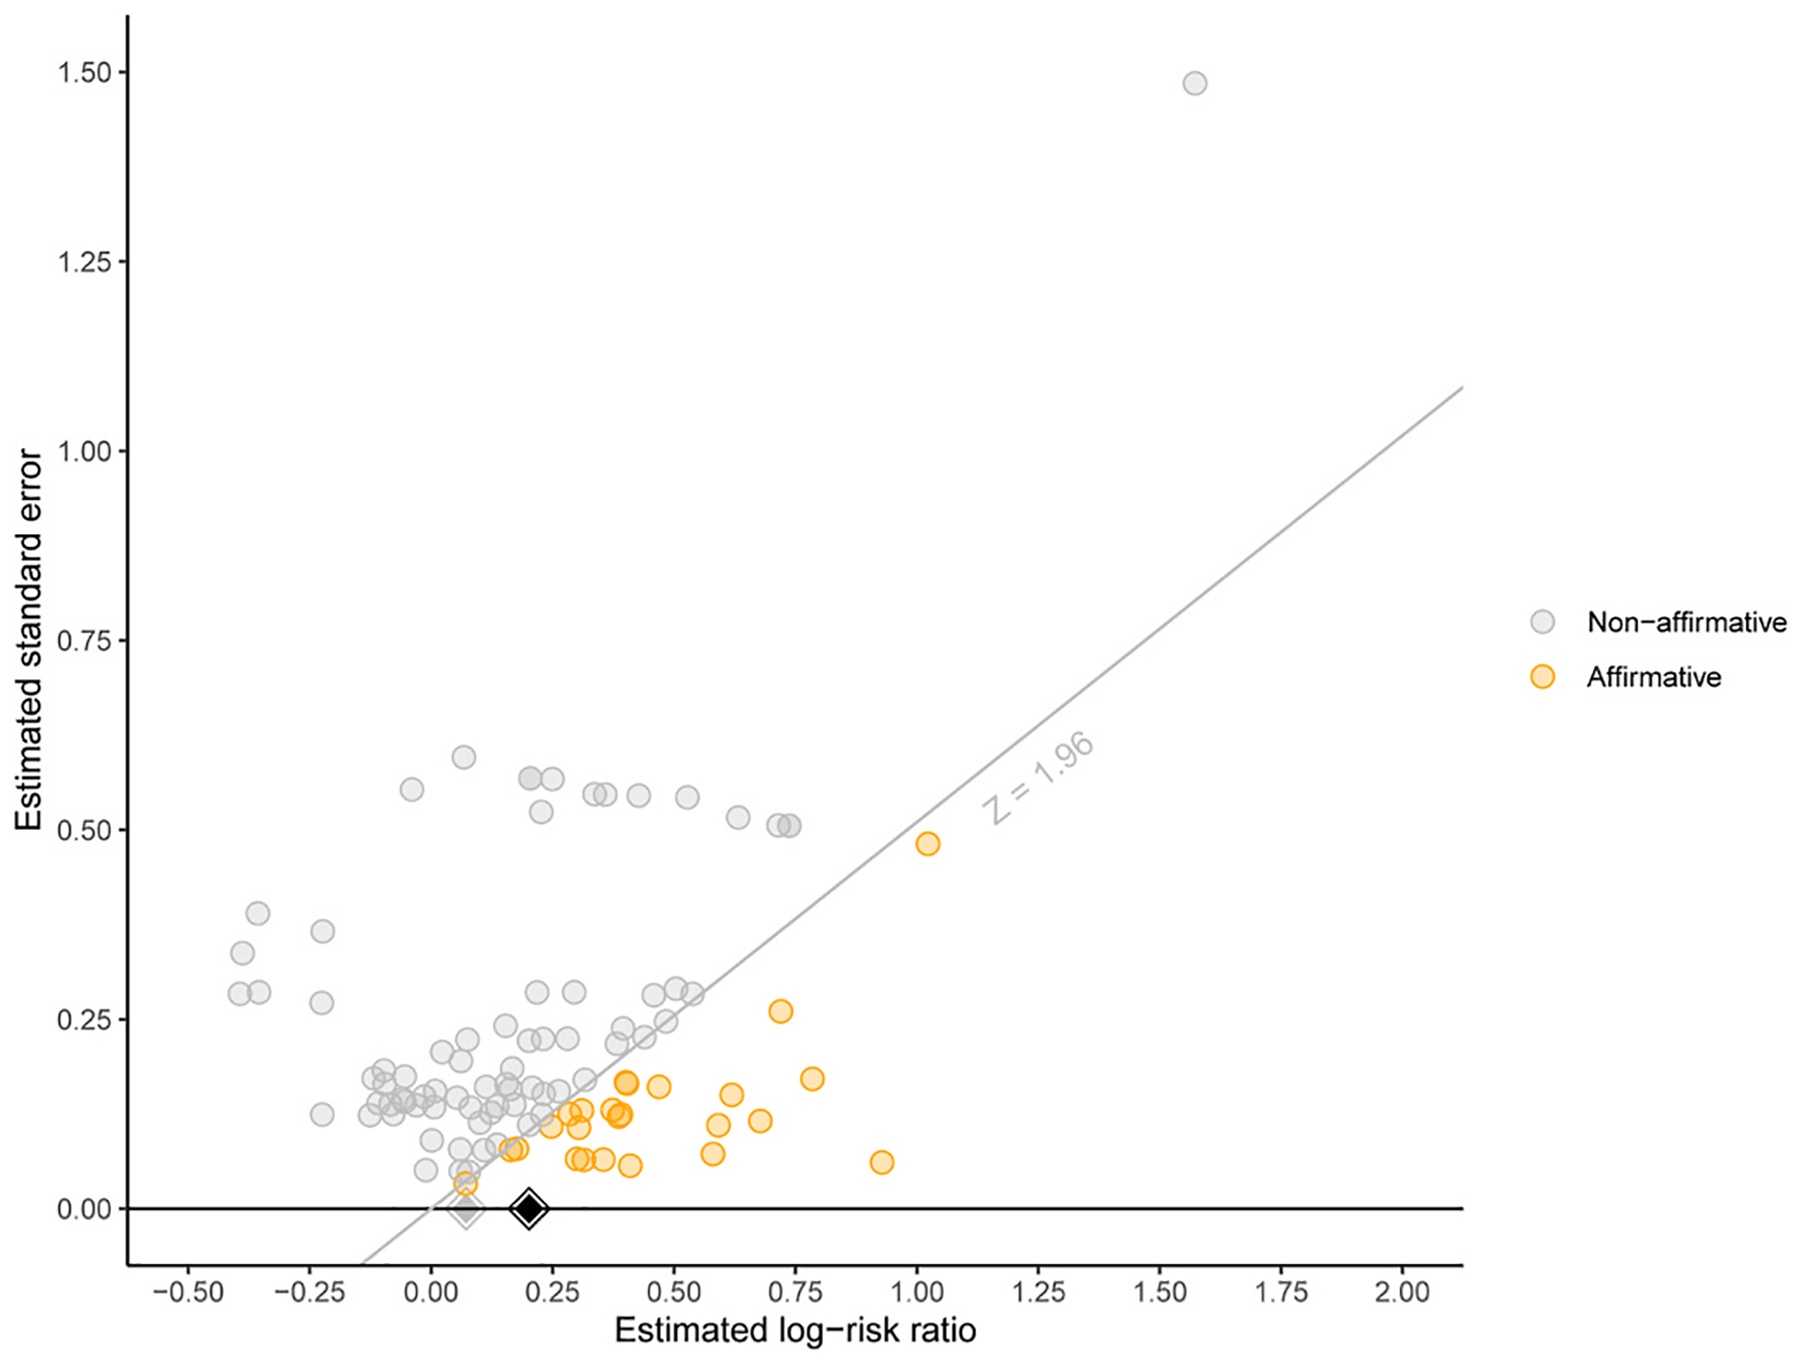
Significance funnel plot displaying studies’ point estimates versus their estimated standard errors. Orange points: affirmative studies (p < 0.05 and a positive point estimate). Grey points: nonaffirmative studies (p ≥ 0.05 or a negative point estimate). Diagonal grey line: the standard threshold of “statistical significance” for positive point estimates; studies lying on the line have exactly p = 0.05. Black diamond: main-analysis point estimate within all studies; grey diamond: worst-case point estimate within only the nonaffirmative studies.