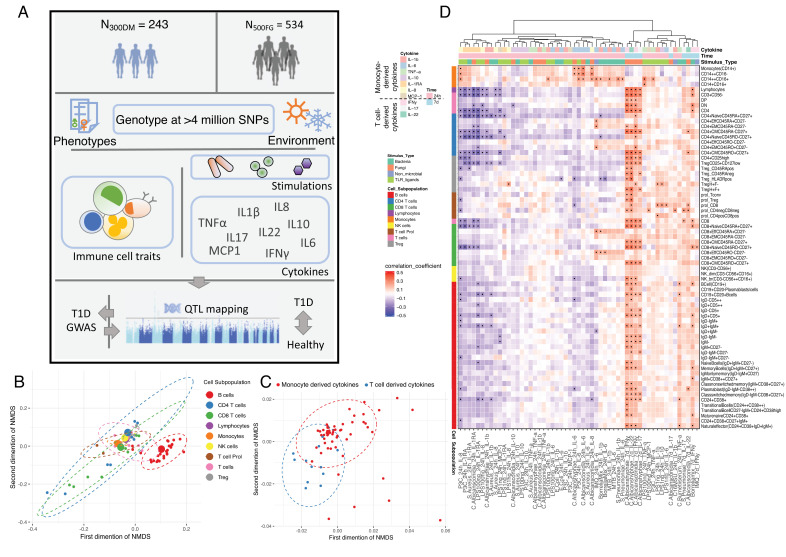
Figure 1. Overview of data and experimental design.
(A) Schematic study design. (B,C) Cell-type (B) and cytokine-type (C) relationship visualized by nonmetric multidimensional scale (NMDS) analysis in 300DM. (B) Cell traits (red) cluster separately from T cell and monocyte traits (B) and cytokines with the same cellular origins cluster together (C). In panel (B), small dots indicate the proportion of subpopulations and large dots indicate counts of their parental cell types. Circles represent the calculated centroid of the grouped cell and cytokine types at confidence level 0.95. (D) Heatmap of correlation coefficients between immune-cell counts (y-axis) and cytokine production in response to stimulations (x-axis) in T1D patients. Significant correlations (FDR < 0.05) are labeled by dots, with color indicating correlation coefficients. Positive correlations (red) are observed between monocyte traits and monocyte-derived cytokines (top left), and between adaptive immune-cell counts and T cell-derived cytokines (bottom right). Negative correlations (blue) are observed between adaptive immune-cell counts and monocyte-derived cytokines.


