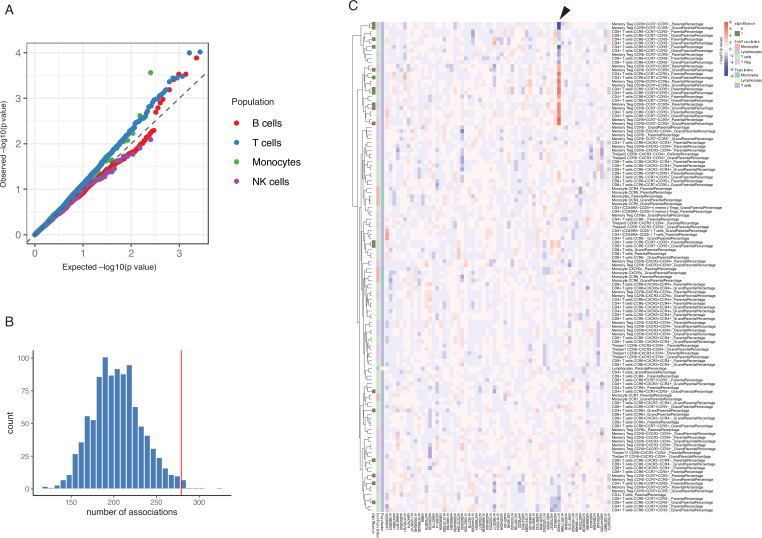
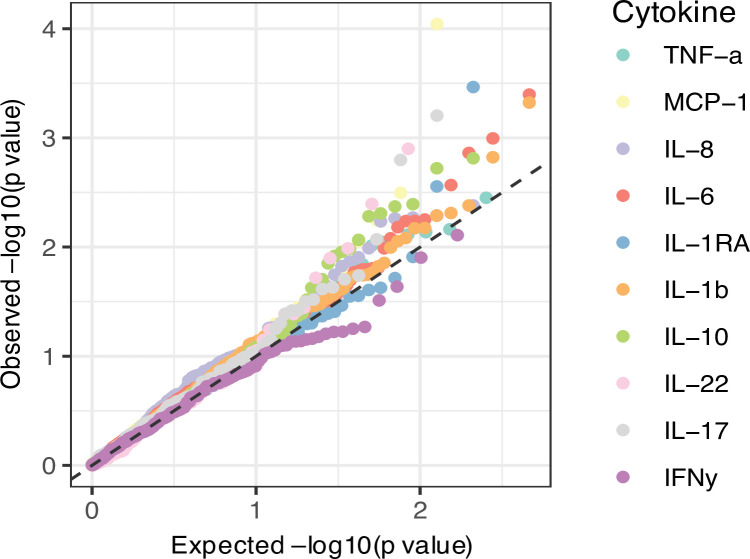
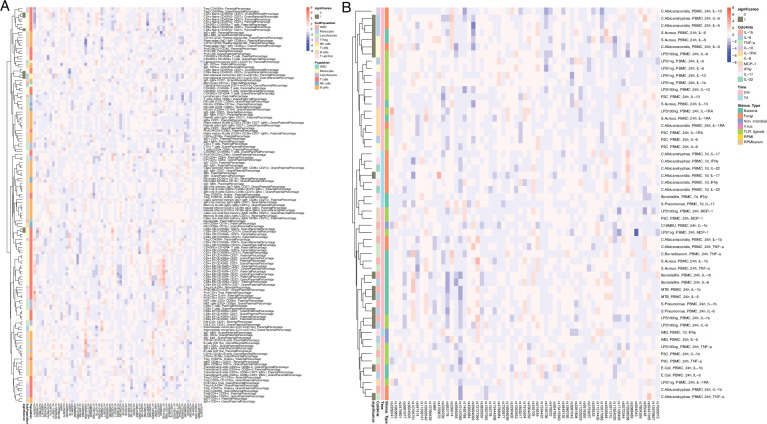
Figure 2. Impact of type 1 diabetes (T1D) genome-wide association studies (GWAS) single-nucleotide polymorphisms (SNPs) on immune phenotypes.
(A) Quantile-quantile (Q-Q) plots of quantitative trait locus (QTL) profiles of 62 T1D GWAS loci grouped by cell populations. The distribution of p-values of associations with T cells traits (blue) shows a significant deviation from an expected uniform distribution (dashed line). (B) Histogram showing number of associations observed (red line) and those in permutations (blue bars). (C) Heatmap of QTL profiles of cell proportion carrying certain chemokine receptors across 62 T1D GWAS loci, colored by −log10(p-values) and effect direction of the T1D risk allele. Arrowhead indicates a T1D risk allele rs11574435-T.


