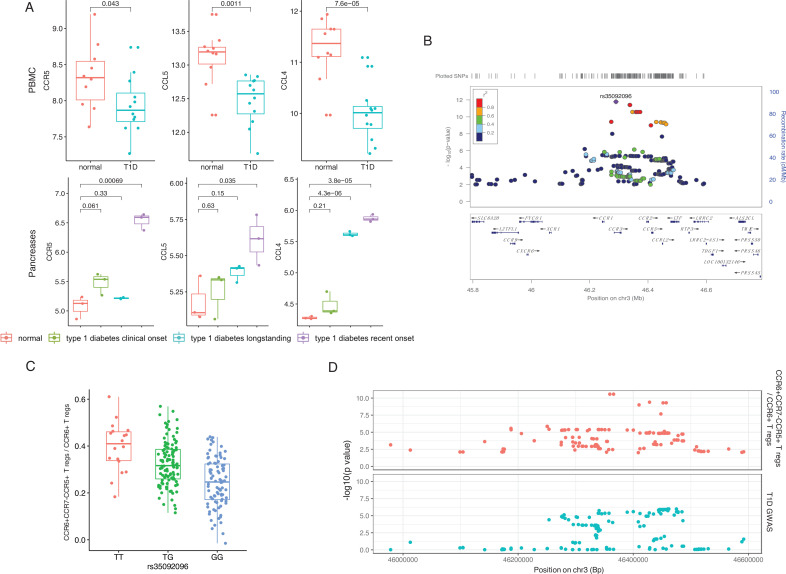
Figure 3. Genetic impact on CCR5-mediated chemokine signaling in type 1 diabetes (T1D).
(A) Expression of CCR5, CCL5, and CCL4 in peripheral blood mononuclear cells (PBMCs) (top) and pancreas (bottom) is altered in T1D patients (blue, green, and purple) compared to healthy controls (red). (B) Locus zoom plot showing that single-nucleotide polymorphisms (SNPs) around rs35092096 located in the CCR region are associated with CCR6+ CCR7− CCR5+ Treg proportion. (C) Boxplot showing that CCR6+ CCR7− CCR5+ Treg proportion differs in different rs35092096 genotypes (TT: red, TG: green, and GG: blue). (D) Two locus zoom plots showing colocalization between CCR6+ CCR7− CCR5+ Treg proportion quantitative trait locus (QTL) profiles (top, red) and T1D genome-wide association studies (GWAS) profile (bottom, blue) within CCR regions.

