. 2022 May 31;11:e73709. doi: 10.7554/eLife.73709

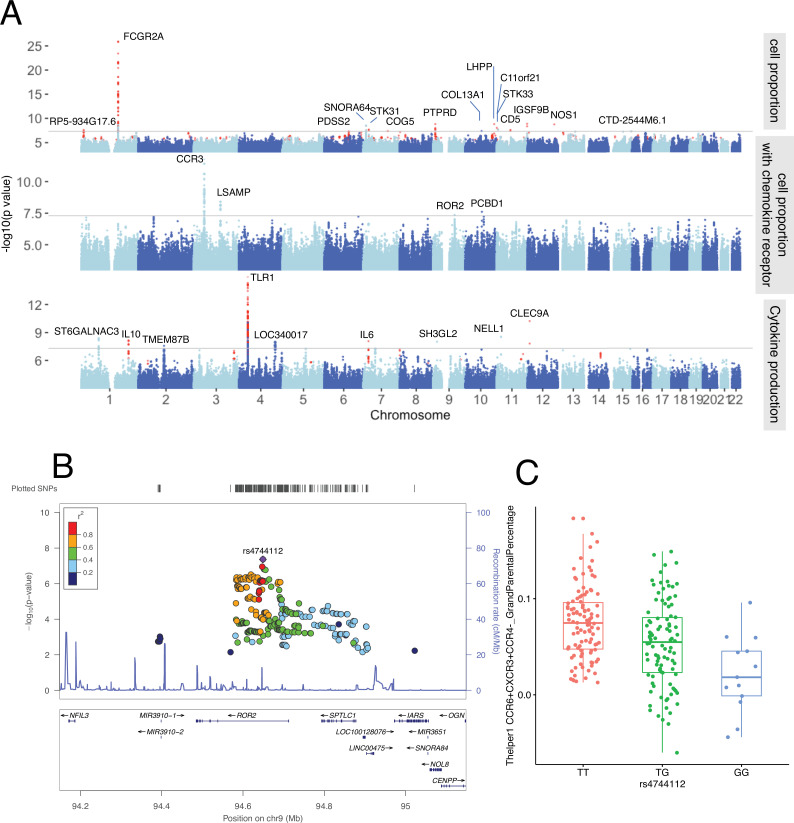
Figure 4. Genetic regulators of immune phenotypes.

(A) Three Manhattan plots showing genetic regulators of immune-cell proportion (top), proportion of immune cells expressing CCR (middle) and cytokines production in response to stimulations (bottom). p-Values of single-nucleotide polymorphisms (SNPs) identified in meta-analysis are colored red. (B) Locus zoom plot showing a type 1 diabetes (T1D)-specific regulatory locus around rs4744112 that effects CCR6+ CXCR3+ CCR4 T helper1 proportion. (C) Boxplot showing how CCR6+ CXCR3+ CCR4 T helper1 proportion varies in different rs4744112 genotypes (TT: red, TG: green, and GG: blue).

Figure 4.

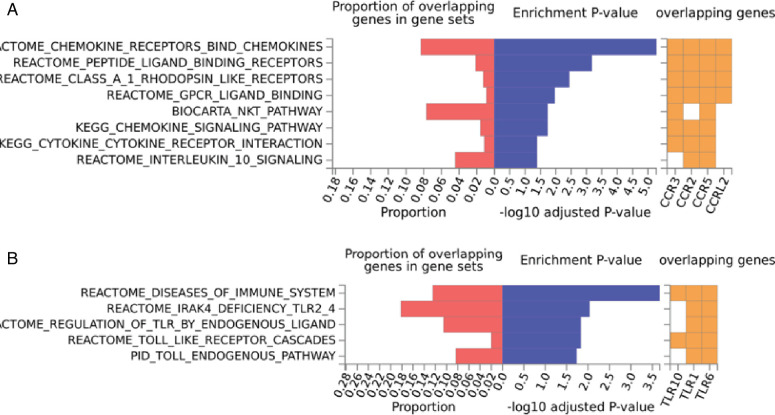
Figure 4—figure supplement 1. Enriched pathways of QTLs found for immune phenotypes.

Figure 4—figure supplement 1.

Pathway enrichment analysis using genes located within immune cell proportion QTLs (A) and cytokine production QTLs (B).
Figure 4—figure supplement 2. Functional annotation of the immune phenotypes associated SNPs (P < 5 × 10⁻⁸).
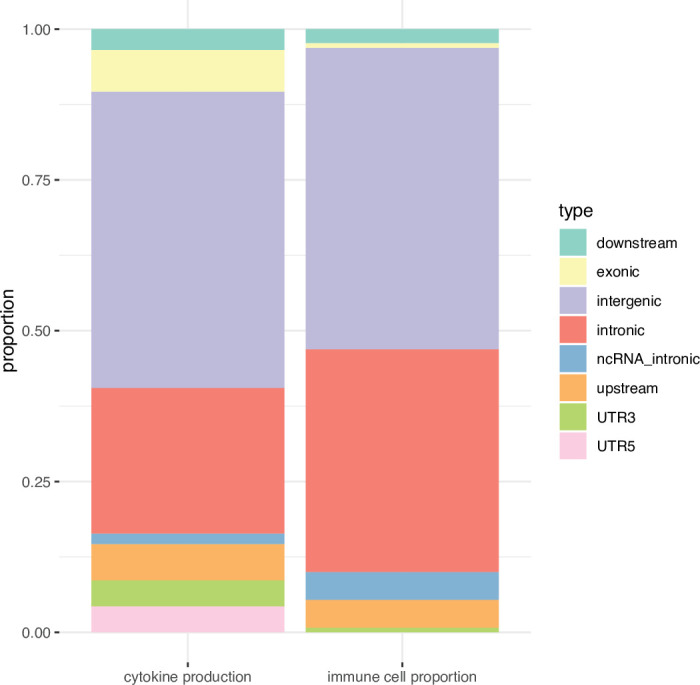
Figure 4—figure supplement 2.

Stacked boxplots showing the percentage of genomic elements where the immune phenotypes associated SNPs located.
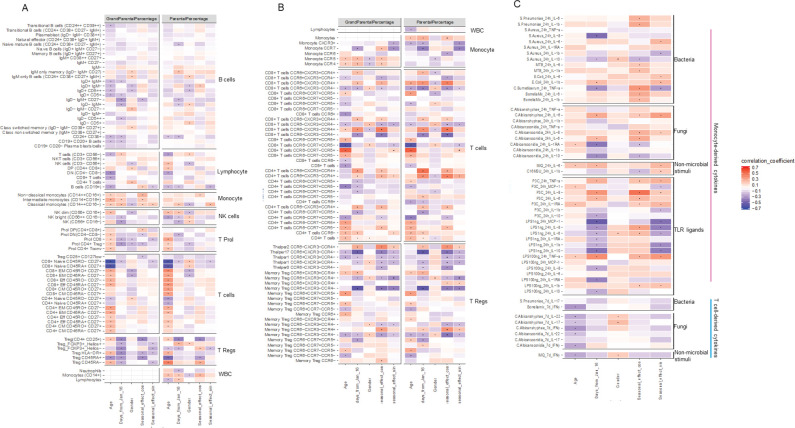
Figure 4—figure supplement 3. Impact of age, gender and seasons on immune phenotypes.

Figure 4—figure supplement 3.

(A, B) Heatmaps of correlation between immune cell counts (y-axis) and age, gender, seasons (x-axis). Correlation coefficients were indicated by colors, and significant correlations (FDR <0.05) are labeled by dots. (C) Heatmap of correlation between cytokines levels upon stimulations and age, gender, seasons. Correlation coefficients were indicated by colors, and significant correlations (FDR <0.05) are labeled by dots.