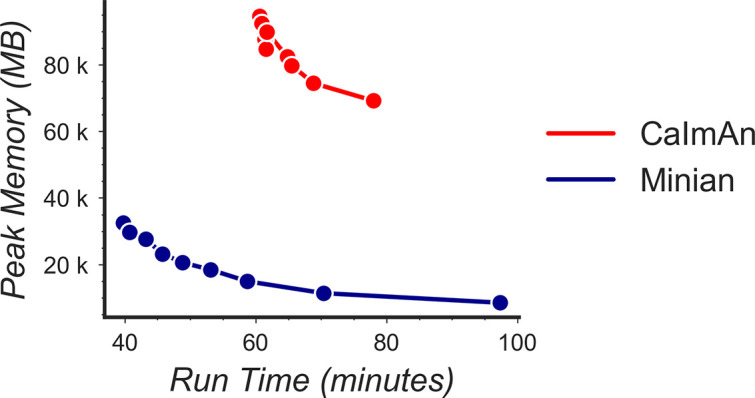
Figure 19. Tradeoff between run time and memory usage.

Simulated data with 500 cells and 28,000 frames were processed through Minian and CaImAn with different numbers of parallel processes. We varied the number of parallel processes from 2 to 10, and the resulting memory usage is plotted as a function of run time. For both pipelines, the curve takes a hyperbola shape, showing the tradeoff between run time and memory usage.
