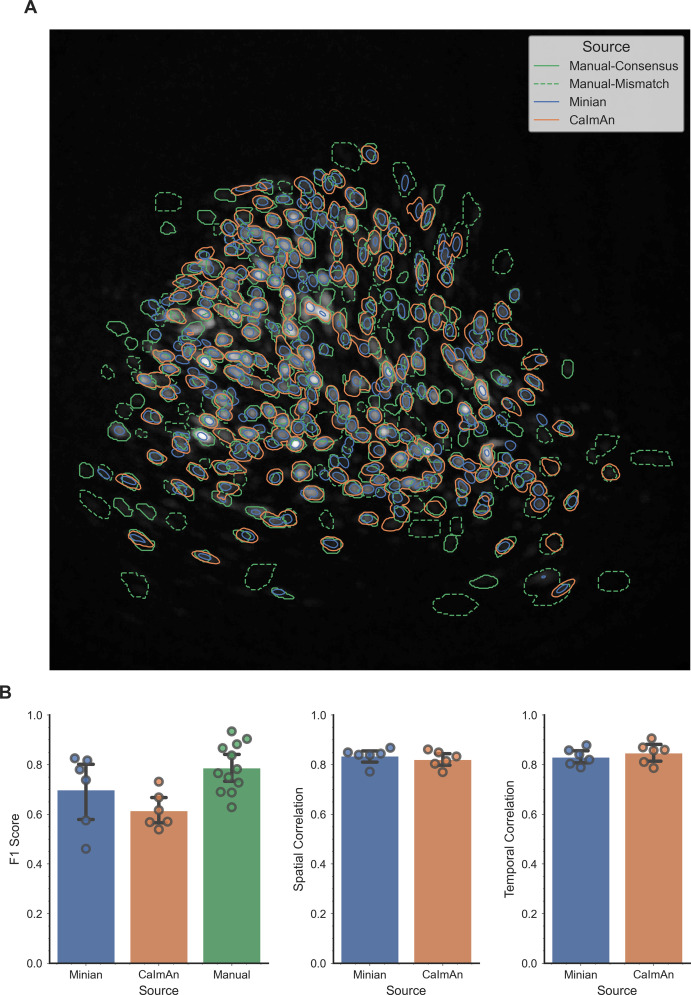
Author response image 1. Validation of Minian with experimental datasets.
An example field of view from one of the experimental datasets is shown in panel A, with contours of detected ROIs overlaid on top. ROIs labeled by human labelers are shown in green, where solid lines indicate ROIs labeled by both labelers (labeled as “Manual-Consensus”) and dashed lines indicate ROIs labeled by one of the labelers (labeled as “Manual-Mismatch”). The F1 scores, spatial footprints correlation and temporal dynamics correlation are plotted for the two pipelines in panel B. The F1 scores of the two human labelers are also included in the plot for comparison (labeled as “Manual”). The F1 scores, spatial footprints correlation and temporal dynamics correlation were all not significantly different across the two pipelines (One-way ANOVA, p > 0.05).

