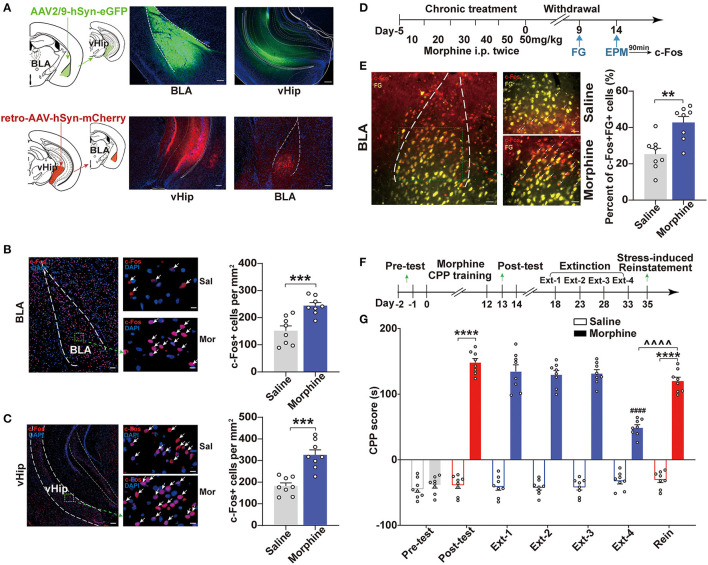
Figure 2.
BLA to vHip projections are involved in the anxiety-like behaviors induced by morphine withdrawal. (A) Schematic for tracing projections from the BLA to the vHip in wild-type mice. Representative coronal images of the injection site and tracing terminals. (Top) The anterograde virus AAV2/9-hSyn-eGFP was delivered in the BLA. (Bottom) The retrograde virus retro-AAV-hSyn-mCherry was delivered in the vHip. Scale bar: 200 μm. Representative immunofluorescence images of c-Fos (red) in the BLA [(B), left] and vHip [(C), left]. The nuclei were stained with DAPI (blue). Scale bar: 200 μm. Arrows indicate neurons co-labeled with c-Fos. Regions enclosed in a green box are shown at higher magnification in the images to the right. Scale bars: 50 μm. The numbers of c-Fos-positive neurons per mm2 in the BLA [(B), right] and vHip [(C), right]. (D) Timeline of c-Fos and fluorogold (FG) co-expression in BLA of Mor-A mice. [(E), Left] Representative coronal image of c-Fos (red) and fluorogold (FG, yellow) immunostaining in the BLA. Scale bar: 100 μm. Regions enclosed by a green box are shown at higher magnification in the images to the right. Arrows indicate neurons co-labeled with c-Fos and FG. Scale bars: 50 μm. (Right) The percentage of neurons co-labeled with c-Fos+ and FG+ relative to FG in the BLA. (F) Schematic of the experimental design for the training and testing of morphine-CPP acquisition, extinction, and reinstatement. (G) CPP scores in the morphine-CPP expression, extinction, and reinstatement tests. Morphine-induced CPP, extinction at Ext-4 and reinstatement induced by stress. In the CPP results, #: comparison between the Extinction-4 of morphine group and the post-test of morphine group, ∧: comparison between the reinstatement of morphine group and the Extinction-4 of morphine group; *: comparison between the 2 indicated groups. BLA, basolateral amygdala. vHip, ventral hippocampus. Data are expressed as the mean ± SEM. **P < 0.01, ***P < 0.001, ****P < 0.0001, ∧∧∧∧P < 0.0001, ####P < 0.0001. n = 6–8/group.

