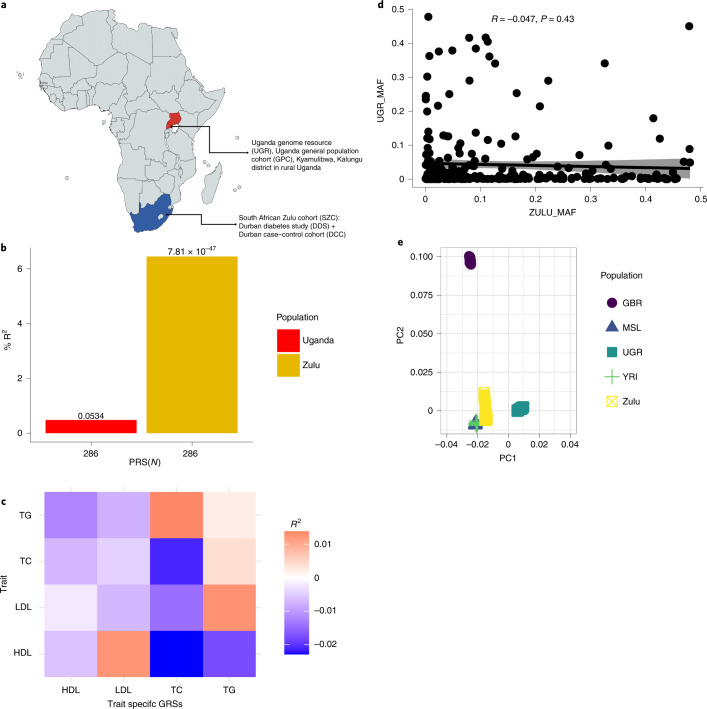
Fig. 2. GRSs of individuals of African ancestry with dyslipidemia.
a, Map of Africa showing sample collection points in Kyamulibwa in Kalungu district, Uganda and Durban, Kwazulu-natal province, South Africa. b, Bar plot showing comparative performance of polygenic prediction of TC using the same GRS comprising 286 SNPs, which was developed in Ugandan cohort (n = 6,407) and then replicated in the South African Zulu cohort (n = 2,598). The y axis is the prediction accuracy (R2), and the x axis is the number of SNPs in the GRS for TC used. c, Correlation coefficients between African American-derived GRSs and serum lipid levels in the Ugandan cohort. d, Scatter plot for the correlation of the same minor allele frequencies (MAF) between the South African Zulu and Ugandan cohorts (R = Pearson correlation, one-sided test). PC, principal component. e, Scatter plot for the principal component analysis of the 1000 Genomes Project reference populations with the South African Zulu and Ugandan cohorts (GBR, British; MSL, Mende; UGR, Uganda genome resource; Zulu, South African Zulu; YRI, Yoruba).

