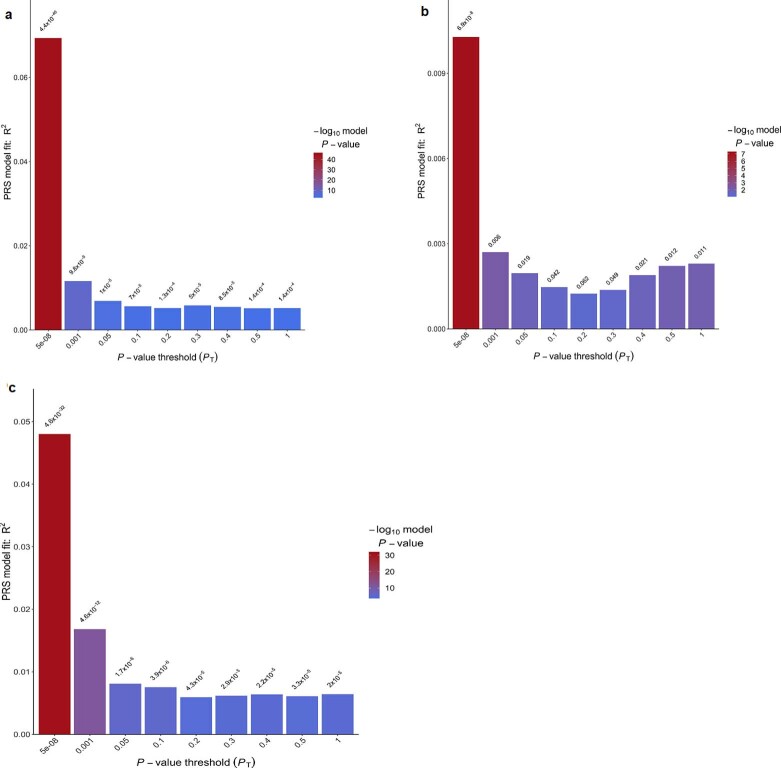
Extended Data Fig. 1. Proportion of variance of TC explained by GRS in the South African Zulu samples using GRS derived from GWAS.
(a) African American ancestry, (a) European ancestry and (a) multiethnic ancestry. The bars represent GRS calculated for subsets of markers at different p-value thresholds. The best GRS in red color was selected based on having the highest proportion of the variance (R2) for the trait in linear models adjusted for age, sex and principal components.

