
Extended Data Fig. 2. Correlation coefficients between GRS and serum lipid levels.
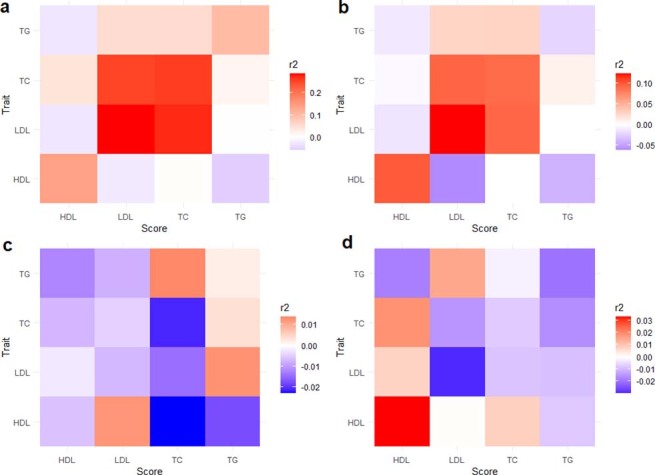
(a) African American derived GRS in the South African Zulu dataset. (b) European derived GRS in the South African Zulu. (c) African American derived GRS in the Ugandan cohort. (d) European derived GRS in the Ugandan cohort. The correlation coefficients r2 are given with colors corresponding to the direction and strength of r2. The r2 on the diagonal represents the strength of correlation of a GRS with its target lipid trait. The off-diagonal r2 represents the strength of correlation of a GRS with other lipid traits.