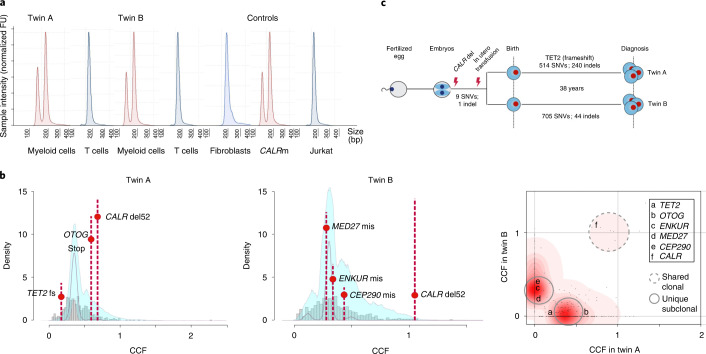
Fig. 1. Genetic lineage tracing confirms a common in utero clonal origin of CALR mutation.
a, Cell-lineage-specific CALR mutational analysis. T cell DNA electropherograms (blue) have a single peak at 207 bp, whereas DNA extracted from myeloid cells (red) shows two peaks, one at 207 bp and another one corresponding to the 52-bp deletion fragment (CALRdel52bp variant allele frequency (VAF) was calculated 28.4%, 32.6% and 43.7 for twin A, twin B and CALR type 1 myelofibrosis (CALRm) control, respectively). The absence of CALR 52-bp deletion in germline DNA was confirmed by analysis of dermal fibroblast DNA from twin B. DNA from a patient with known CALR type 1 myelofibrosis and DNA from Jurkat cells were used as positive and negative controls, respectively. Rearranged electropherograms from parallel experiments, all scaled to sample. FU, fluorescence units. b, Statistical modeling of the distribution of subclonal and clonal mutations by Dirichlet-process clustering. The histogram of mutations is represented with gray bars, with the fitted distribution as a gray line; 95% posterior confidence intervals for the fitted distribution are also shown (pale blue area). In the rightmost panel, a two-dimensional density plot shows Dirichlet clustering of the fraction of cancer cells (CCF) within each twin for all somatic mutations detected (black dots). Higher posterior probability of a cluster is indicated by increasing intensity of red. The cluster indicated around (1,1) corresponds to mutations present in all cells in both twins; clusters along the axes correspond to twin-specific clones. A subset of nonsilent coding mutations found in TET2, OTOG, ENKUR, MED27, CEP290 and CALR are highlighted. c, Schematic representation of the shared in utero clonal origin and number of high-confidence shared variants and separate postnatal clonal evolution with total number of SNV and indels for each twin shown. fs, frameshift; mis, missense.

