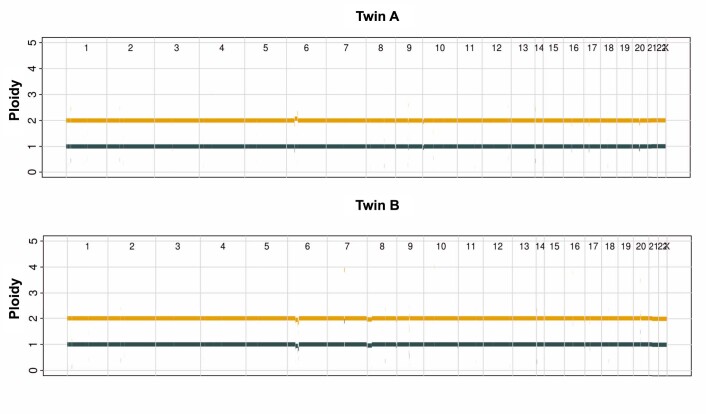
Extended Data Fig. 4. Genome-wide copy number profiles of twin A and twin B.
Copy number profiles of twin A and twin B estimated using the Battenberg algorithm. The gold line corresponds to total copy number, the dark blue line corresponds to copy number of the minor allele. Average ploidy was estimated to be 1.98 and 2.03 for twin A and twin B, respectively. Aberrant cell fraction (cellularity) was estimated as 100% and 92% for twin A and twin B, respectively.

