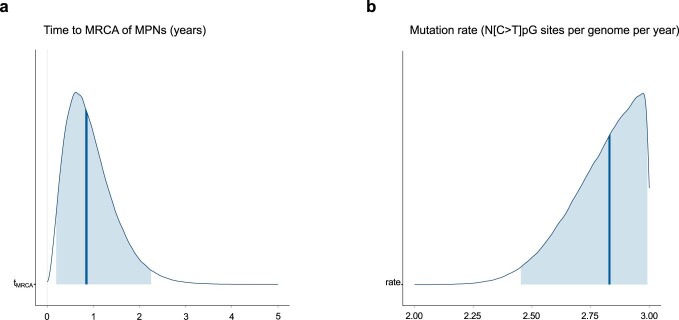
Extended Data Fig. 5. Posterior interval estimates from Markov chain Monte Carlo draws for (a) time to the most recent common ancestor (MRCA) of myeloproliferative neoplasms in twin A and twin B and (b) mutation rate.
Posterior distributions with median (thick dark blue line) and 95% confidence interval (shaded blue area) for (a) MRCA timing and (b) mutation rate estimated using the numbers of somatic cytosine-to-thymine single-nucleotide variants (SNVs) at CpG sites (N[C>T]pG) in each twin. a. Time to MPN origin is estimated as years post-zygote (horizontal axis). b. Mutation rate is estimated as number of N[C>T]pG sites per genome per year (horizontal axis). N[C>T]pG mutation rate is truncated at an upper bound of 3 N[C>T]pG per genome per year; this bound was based on the highest N[C>T]pG rate reported in any Myeloid-MPN case in Gerstung et al.3.

