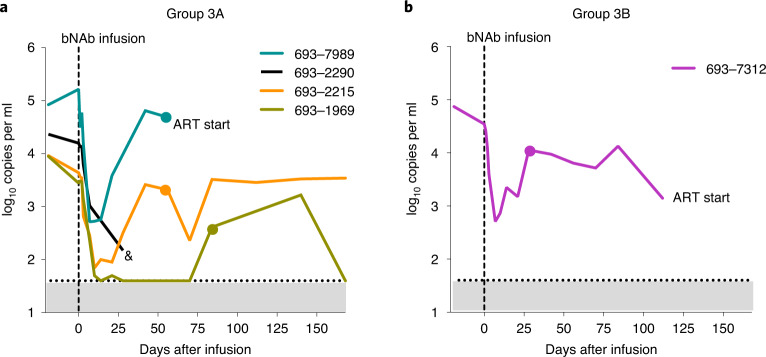
Fig. 2. HIV-1 RNA levels.
Plasma HIV-1 RNA levels (RNA copies per ml) are shown after PGDM1400, PGT121 and VRC07-523LS infusion at 20 mg kg−1 each (group 3A) (a) and after PGDM1400 and PGT121 infusion at 30 mg kg−1 each (group 3B) (b) in viremic participants with HIV not on ART. The dotted line indicates the LLoQ for HIV-1 RNA levels (40 copies per ml). Dots indicates when a sample was collected for sequencing. If and when ART was started is indicated in the figures. The symbol ‘&’ indicates the time point when participant 693–2290 was lost to follow-up.

