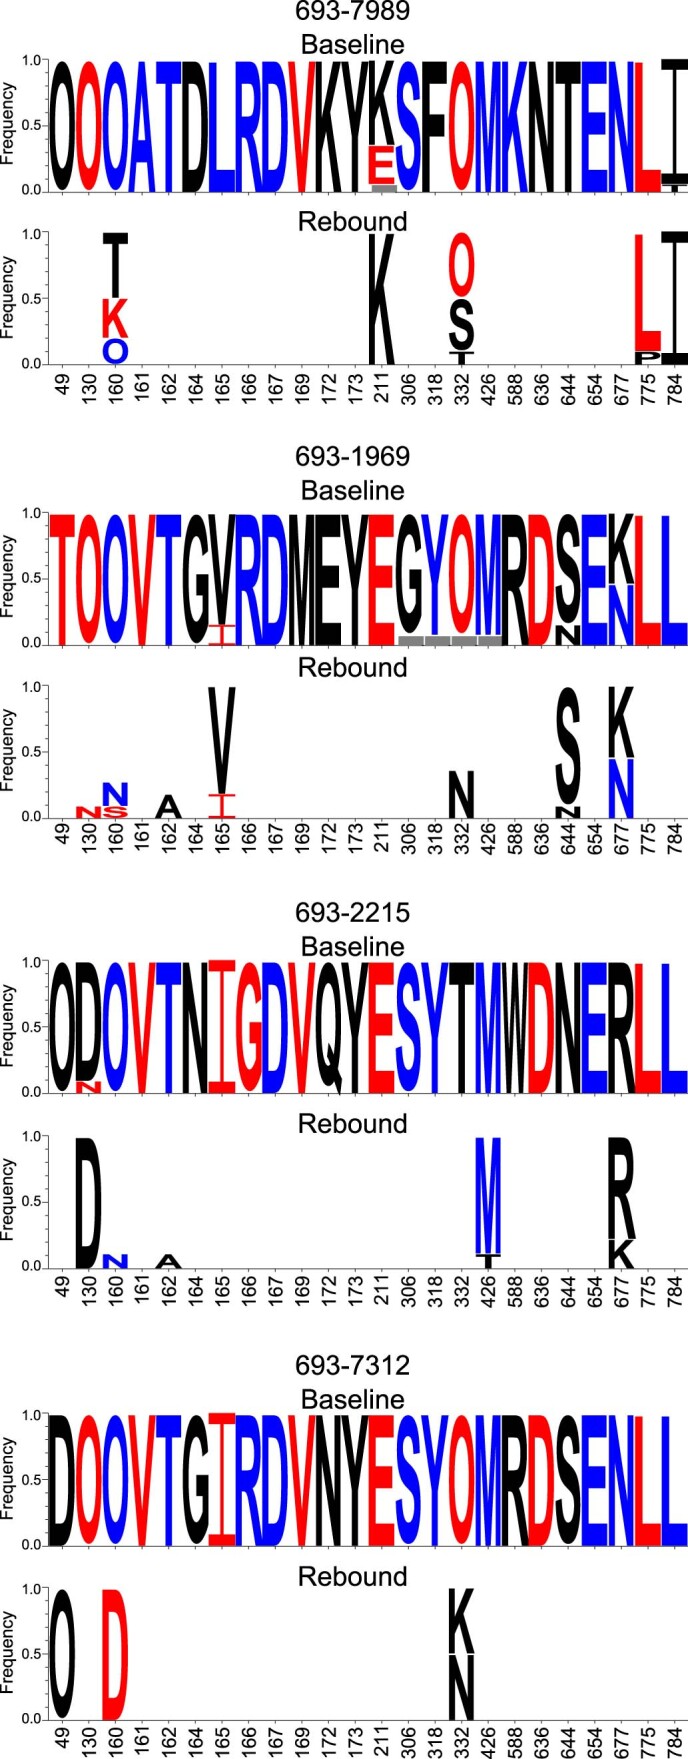
Extended Data Fig. 4. Mutations at PGDM1400 signature sites.

All isolated Envs from each participant are used for these analyses. All HXB2 sites significantly associated with sensitivity/resistance to PGDM1400 from Bricault et al.1 are shown. At these sites, frequency of amino acids are shown as logos with height of the letter indicating its frequency. For each PTID, top logos show the baseline Envs, and bottom show rebound Envs. To highlight differences, amino acids in the rebound Envs that are invariant from the baseline Envs are whitened out. If the baseline Envs had two or more variants, from which one was found in the rebound Envs, those variants are still shown (for example site 211 in 693-7989). Blue amino acids are associated with sensitivity to PGDM1400, red with resistance, and black showed no significant associations. O represents Asn in an N-linked glycan sequon (N-X-S/T where X is not Pro). Grey box indicates deletion.
