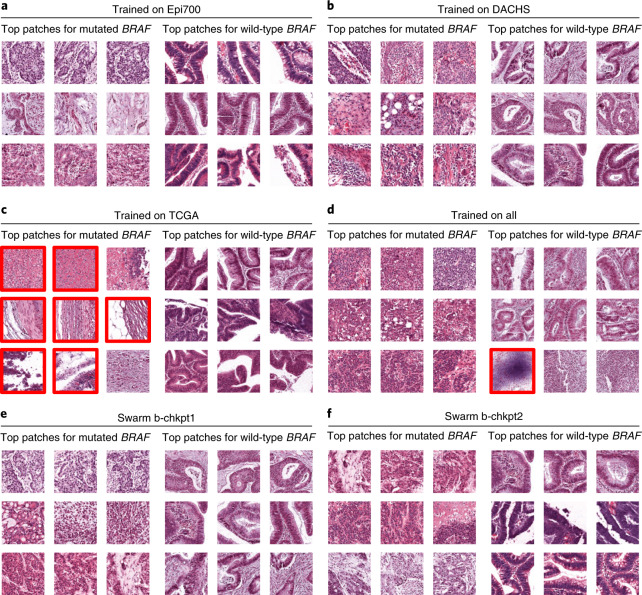
Fig. 4. Highly predictive image patches for BRAF prediction.
All patches are from the QUASAR test set and were obtained using the median model (out of five repetitions) trained on 300 randomly selected patients per training cohort. a–f, Model trained on Epi700 (a), model trained on DACHS (b), model trained on TCGA (c), model trained on all three datasets (d), swarm chkpt1 (e), swarm chkpt2 (f). Tiles with red borders contain artifacts or more than 50% nontumor tissue.

