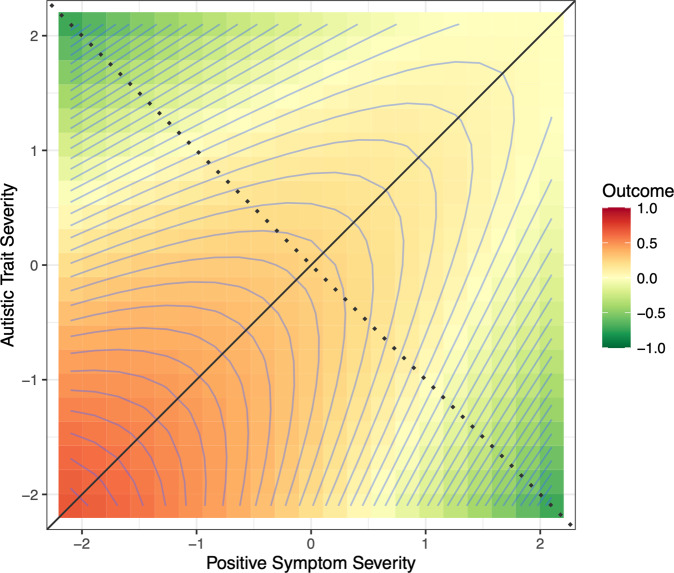
Fig. 1. A contour response-surface plot depicting the hypothesized association of the co-expression of autistic traits and positive symptoms (or risks) with functional outcome according to the revised diametric model.
The balance axis (solid diagonal line) represents equal expressions of autistic traits and positive symptoms (or risks). The bias axis (dotted diagonal line) is orthogonal to the balance axis and represents the relative and progressive dominance of autistic traits and/or positive symptoms (or risks), deviating from the center (0, 0) in opposite directions. The contour lines represent functional outcome, ranging from low functional outcome (green) to high functional outcome (red). Along the bias axis, individuals with either elevated autistic traits or positive symptoms (or risks) are equally dysfunctional. Relative to individuals with biased expressions/risks, better functional outcome is expected for individuals with equal expressions/risks. Along the balance axis, functioning, however, is expected to diminish in individuals with high co-expressions of symptoms/risks.

