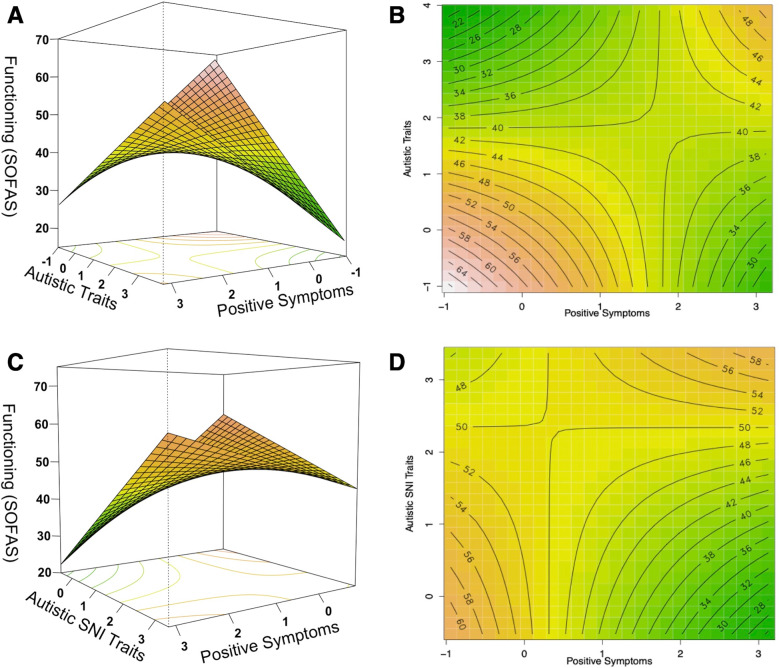
Fig. 3. The relationship between autistic traits and positive symptom severity with functioning (SOFAS) in the first episode psychosis group, where red corresponds to better functioning and green to lower functioning.
A, B show the response surface and corresponding contour plot of the positive interaction between autistic traits and positive symptoms on functioning, with sex and education level as covariates. C, D show the response surface and corresponding contour plot of the positive interaction between autistic stereotypies/narrowed interests (SNI) traits and positive symptom on functioning, with sex and education level as covariates. The Johnson-Neyman probes of the interactions are visualized in Supplementary Fig. S5.

