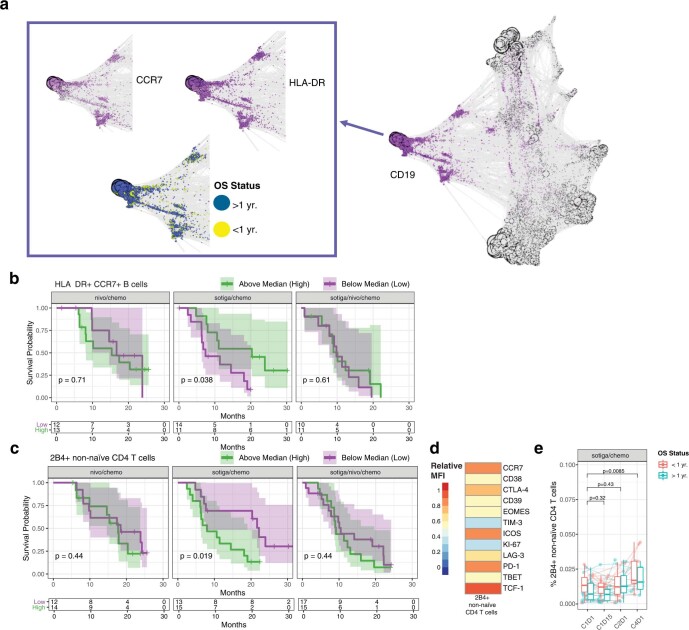
Extended Data Fig. 5. Higher frequencies of specific B cell populations and lower concentrations of 2B4+ T cells are associated with survival in patients treated with sotiga/chemo.
a, Force-directed graph visualization of unsupervised clustering of cells from CyTOF across all patients and timepoints, illustrating a specific population of B cells (CD19+, CCR7+, HLA-DR+) associating with survival and followed up on with gating analysis in further panels. b, KM curves for overall survival stratified by frequencies of pretreatment circulating HLA-DR+ CCR7+ B cells out of total leukocytes, above and below the median frequency. c, KM curves for overall survival stratified by frequency of pretreatment circulating 2B4+ non-naïve CD4 T cells out of total non-naïve CD4 T cells. d, Heatmap of pretreatment relative median fluorescence intensity of markers present on 2B4+ non-naïve CD4 T cells across all patients. e, Frequencies of 2B4+ non-naïve CD4 T cells pretreatment (C1D1) and on-treatment (C1D15, C2D1, and C4D1), grouped by survival status at 1 year. Box plots show median and quartiles and whiskers depict 95% CI. Individual patient values are shown in thin lines and colored by survival status at 1 year. P-values represent two-sided Wilcoxon signed-rank tests between timepoints, illustrating changes on-treatment. On all KM curves, median values were determined using all data across the 3 arms, P-values are from a log-rank test between groups, and shaded regions illustrate 95% CI. Sample sizes for cell populations shown in e: n = 28, 23, 27 and 18 biologically independent samples at C1D1, C1D15, C2D1 and C4D1.

