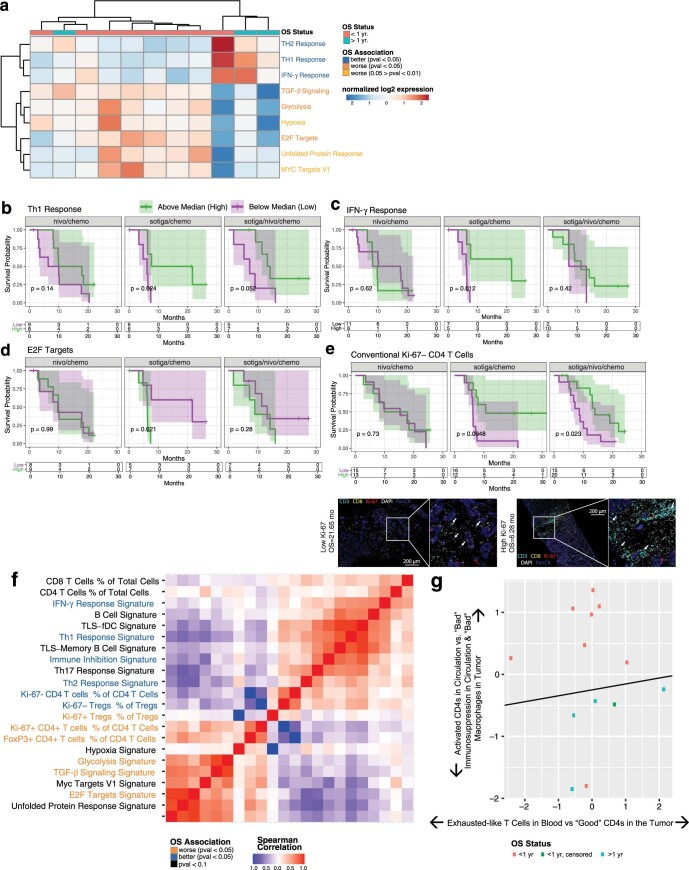
Extended Data Fig. 6. T helper signatures and proliferating CD4 T cells in the tumor associate with survival in patients receiving sotiga/chemo treatment.
a, Heatmap showing results of unsupervised clustering of gene expression signatures and survival status in the sotiga/chemo arm. Individual patients are shown in columns and annotated by survival status at 1 year to illustrate association. Gene expression signature labels are color coded based on survival association by log-rank test, calculated independently from unsupervised clustering. b, c, d, KM curves for overall survival stratified by median values of Th1 (b), IFNγ (c), and E2F (d) gene expression signatures. e, KM curve for overall survival stratified by median values of Ki-67− Foxp3- CD4 T cells from mIF on pretreatment tumor samples (e, top panel) and representative images from tumor samples high and low in Ki-67- Foxp3- CD4 T cells (e, bottom panel). Labels indicate marker grouping and patient survival values. f, Spearman correlation matrix of tumor immune infiltrate and gene expression signatures in pretreatment tumor biopsies, with labels colored by association with overall survival by log-rank test. g, Multi-omic dimensionality reduction of circulating factors and tumor data using Independent Component Analysis, with each dot representing a single patient colored by survival status at one year and with position determined by reduced dimensionality across all tumor and circulating biomarkers. Black separating line serves to illustrate a separation and is not computationally derived. On all KM curves, median values were determined using all data across the 3 arms, P-values are from a log-rank test between groups, and shaded regions illustrate 95% CI.

