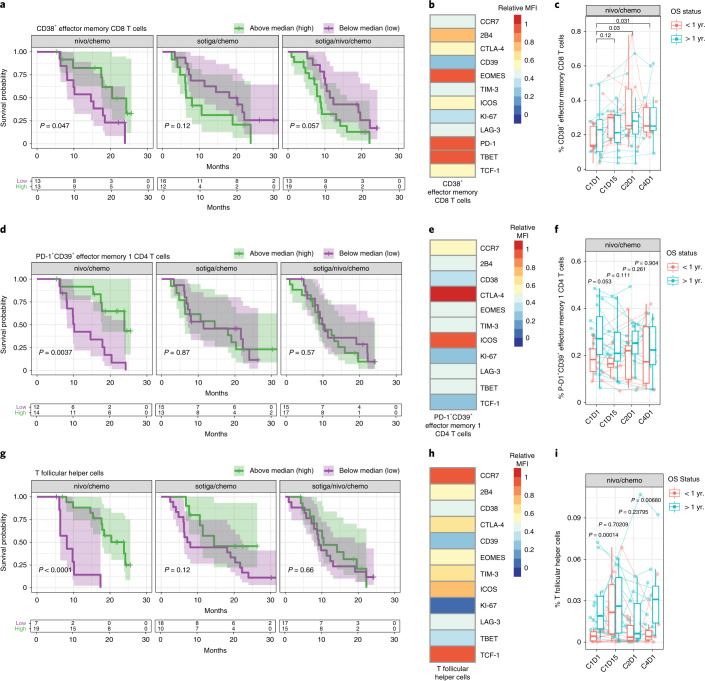
Fig. 3. Activated, antigen-experienced non-naive T cells and Tfh cells in the periphery are associated with survival in patients with mPDAC treated with nivo/chemo.
a, Kaplan–Meier curves for OS stratified by frequencies of circulating CD38+ EM CD8 T cells by flow cytometry, pre-treatment (C1D1) above and below the median frequency. b, Heat map of relative median fluorescence intensity of markers on CD38+ EM CD8 T cells from pre-treatment PBMC samples across patients in the nivo/chemo arm. c, Frequencies of CD38+ EM CD8 T cells pre-treatment (C1D1) and on-treatment PBMC samples (C1D15, C2D1 and C4D1), grouped by patient survival status at 1 year. d, Kaplan–Meier curves for OS stratified by frequencies of circulating PD-1+CD39+ EM1 CD4 T cells. e, Heat map of relative median fluorescence intensity of markers present on PD-1+CD39+ EM1 CD4 T cell population from pre-treatment PBMC samples across patients in the nivo/chemo arm. f, Frequencies of PD-1+CD39+ EM1 CD4 T cells in pre-treatment (C1D1) and on-treatment PBMC samples (C1D15, C2D1 and C4D1), grouped by patient survival status at 1 year. g, Kaplan–Meier curves for OS stratified by frequencies of circulating Tfh (CXCR5+PD-1+CD4+) cells. h, Heat map of relative median fluorescence intensity of markers present on pre-treatment Tfh cells across all patients from pre-treatment PBMC samples in the nivo/chemo arm. i, Frequencies of Tfh cells pre-treatment and on-treatment (C1D15, C2D1 and C4D1). For all cell populations shown, frequencies are out of parent population. Box plots show median and quartiles, and whiskers depict 95% CI. Individual patient values are shown in thin lines. Color depicts survival status at 1 year. P values for time series represent two-sided Wilcoxon signed-rank tests between time points, illustrating changes on-treatment (c) or survival groups at each time point (f and i). On Kaplan–Meier curves, median values were determined using all data across the three arms; P values are from a log-rank test between groups; and shaded regions illustrate 95% CI. Sample sizes for cell populations are shown (c, f and i): n = 26, 21, 25 and 19 biologically independent samples at C1D1, C1D15, C2D1 and C4D1, respectively.

