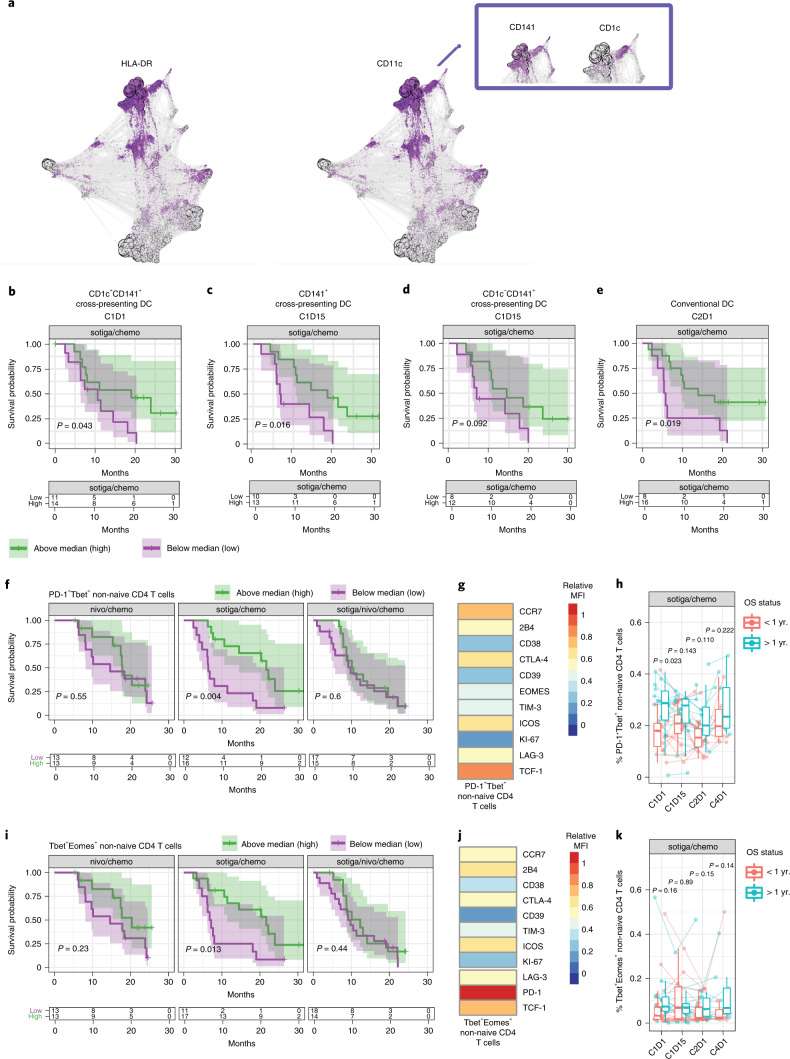
Fig. 4. Cross-presenting, activated APCs and type-1 helper T cells in circulation associate with survival in patients receiving sotiga/chemo treatment.
a, Force-directed graph visualization of unsupervised clustering of cells from CyTOF across all patients and time points, with callout box of DC phenotypes associating with survival and followed up on with gating analysis in further panels. b–f, Kaplan–Meier curve for OS stratified by median values. b, Circulating CD1c+ cross-presenting DCs (CD141+) at C1D1 c, Cross-presenting DCs (CD141+) at C1D15. d, CD1c− cross-presenting DCs (CD141+) at C1D15. cDCs at C2D1 (e) and pre-treatment PD-1+Tbet+ non-naive CD4 T cells (f). g, Heat map of pre-treatment median fluorescence intensity of markers present on PD-1+Tbet+ non-naive CD4 T cells. h, Frequencies of PD-1+Tbet+ non-naive CD4 T cells pre-treatment (C1D1) and on-treatment (C1D15, C2D1 and C4D1), grouped by survival status at 1 year. i, Kaplan–Meier curves for OS stratified by frequency of pre-treatment Tbet+Eomes+ non-naive CD4 T cells. j, Heat map of pre-treatment median fluorescence intensity of markers present on Tbet+Eomes+ non-naive CD4 T cells. k, Frequencies of Tbet+Eomes+ non-naive CD4 T cells pre-treatment (C1D1) and on-treatment (C1D15, C2D1 and C4D1), grouped by survival status at 1 year. For DC populations, frequencies are out of total leukocytes. For T cell populations, frequencies are out of parent. Box plots show median and quartiles, and whiskers depict 95% CI. Individual patient values are shown in thin lines and colored by survival status at 1 year. P values for time series represent two-sided Wilcoxon signed-rank tests between survival groups at each time point. On Kaplan–Meier curves, median values were determined using all data across the three arms; P values are from a log-rank test between groups; and shaded regions illustrate 95% CI. Sample sizes for cell populations (a−e): n = 29, 23, 24 and 22 biologically independent samples at C1D1, C1D15, C2D1 and C4D1, respectively. Sample sizes for cell populations are shown (f–k): n = 28, 23, 27 and 18 biologically independent samples at C1D1, C1D15, C2D1 and C4D1, respectively.

