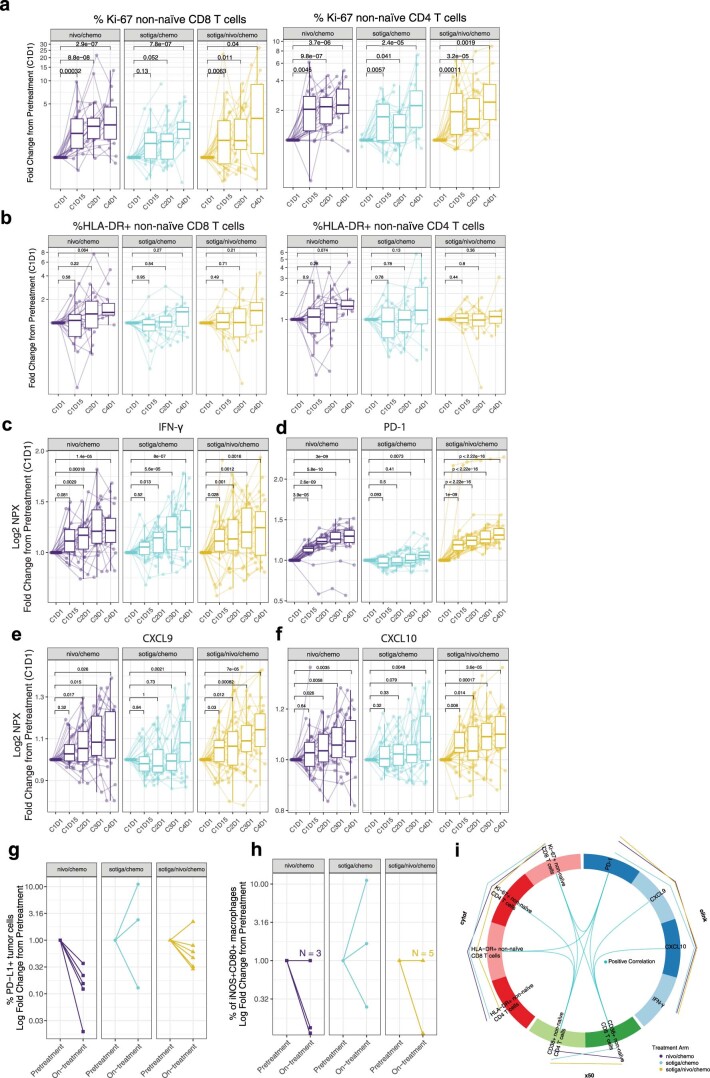
Extended Data Fig. 3. Biomarker signatures in blood and tumor reveal specific immune mechanisms of activation in response to nivo/chemo and sotiga/chemo treatment in patients with mPDAC.
a, Change in frequencies of circulating Ki-67+ non-naïve CD8 (left panel) and CD4 (right panel) T cells, as a fraction of total non-naïve CD8 or CD4 T cells respectively, in patients from each arm over the course of treatment by flow cytometry. b, Change in frequencies of circulating HLA-DR+ non-naïve CD8 (b, left panel) and CD4 (b, right panel) T cells, as a fraction of total non-naïve CD8 or CD4 T cells respectively, in patients from each arm over the course of treatment by Cytof. c,d,e,f, Change in Log2 expression of circulating IFN-γ (c), PD-1 (d), CXCL9 (e) and CXCL10 (f) from pretreatment values from each arm by Olink analysis. Timeseries box plots in a-f are shown as fold change relative to C1D1 and plotted on a pseudo-log scale. Median values and quartiles are shown. The whiskers depict 95% CI. Individual patient values are shown in thin lines and colored by survival status at 1 year. P-values represent two-sided Wilcoxon signed-rank tests between timepoints, illustrating increases on-treatment. g, h, Frequencies of PD-L1+ tumor cells (g) and intratumoral iNOS+CD80+ macrophages (h) from mIF of on-treatment biopsies (C2D1 when feasible, see methods for details), shown as a fold change relative to pretreatment biopsy for each arm. i, DIABLO Circos plot showing results of integrative analysis where select factors from CyTOF, X50 flow cytometry and Olink, significantly associated with on-treatment (C2D1) effects and correlations among these factors and treatment arms. In the Circos plot, lines outside the circle indicate magnitude and direction of treatment association (the further distance from the circle, the greater the association). Lines inside the plot indicate positive (blue) correlations between biomarker factors. For all cell populations shown, frequencies are out of parent population. Sample sizes for all cell populations identified through CyTOF analysis (b): n = 25, 20, 23, 13; n = 29, 23, 24, 22; n = 26, 20, 26, 13 biologically independent samples at C1D1, C1D15, C2D1 and C4D1 in nivo/chemo, sotiga/chemo, sotiga/nivo/chemo treatment arms, respectively. Sample sizes for all cell populations identified through flow cytometry analysis (a): n = 26, 21, 25, 19; n = 28, 23, 27, 18; n = 32, 27, 29, 14 biologically independent samples at C1D1, C1D15, C2D1 and C4D1 in nivo/chemo, sotiga/chemo, sotiga/nivo/chemo treatment arms, respectively. Sample sizes for all soluble proteins identified through proteomic analysis (c,d,e,f): n = 32, 25, 27, 25, 23; n = 36, 29, 31, 25, 27; n = 35, 27, 32, 26, 25 biologically independent samples at C1D1, C1D15, C2D1, C3D1, and C4D1 in nivo/chemo, sotiga/chemo, sotiga/nivo/chemo treatment arms, respectively. Sample sizes for all cell populations identified through mIF (g,h): n = 5, 3, 6, biologically independent matched paired samples at C1D1 and approximately C2D1 in nivo/chemo, sotiga/chemo, sotiga/nivo/chemo treatment arms, respectively. (i): n = 22, 23, 21 biologically independent matched samples at C2D1 in nivo/chemo, sotiga/chemo, sotiga/nivo/chemo treatment arms respectively for CyTOF, X50 flow cytometry and Olink integrative analysis.

