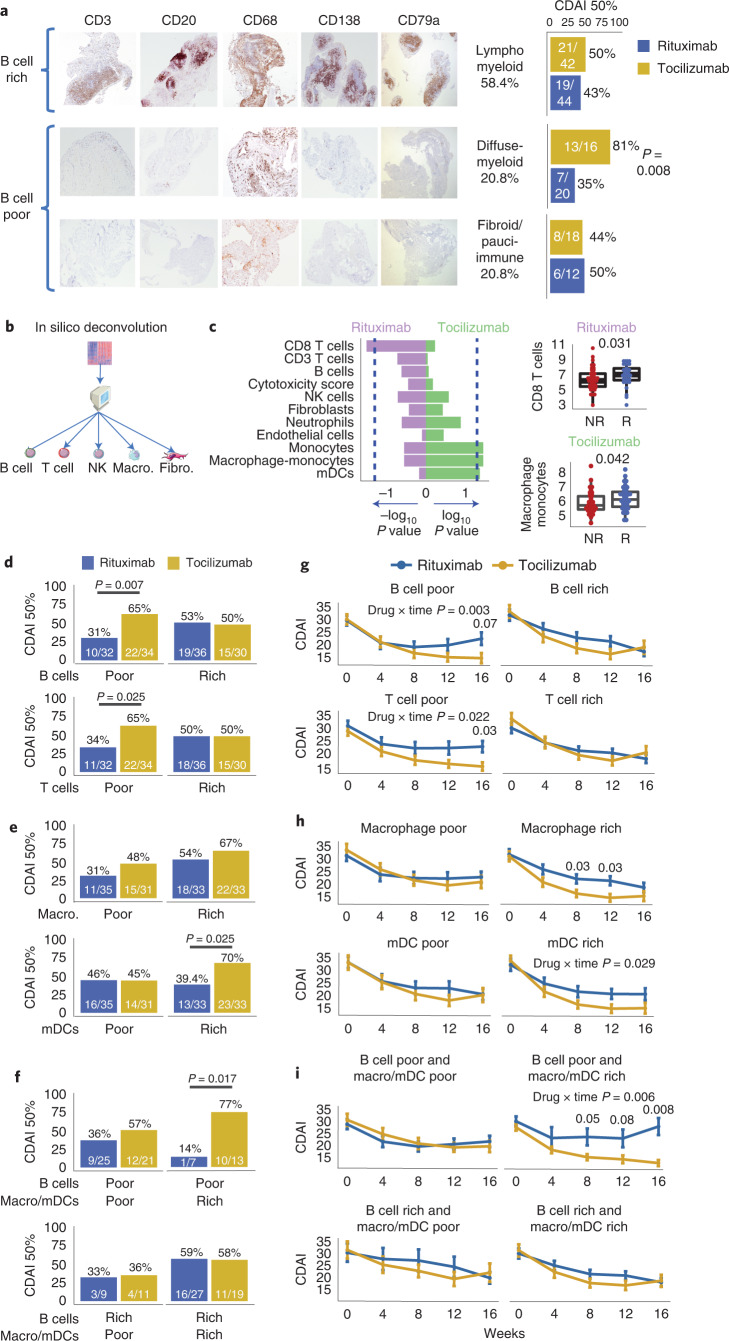
Fig. 1. Synovial histological markers at baseline associate with response to rituximab and tocilizumab.
a, Classification into synovial pathotypes according to semiquantitative scores for CD3+ T cells, CD20+ B cells, CD68+ macrophages and CD138+ plasma cells, with representative examples from patients classified as lymphomyeloid (CD20 ≥ 2 and/or CD138≥2), diffuse-myeloid (CD68SL≥2, and CD20/CD138<2) or fibroid/pauci-immune (CD68SL/CD20/CD138<2). Right, 16-week CDAI 50% response in patients stratified by pathotype (n = 152). Bar plots showing the proportion of CDAI 50% responders for rituximab (in blue) and tocilizumab (in yellow) within each pathotype, with corresponding exact numbers. Fisher's test, exact P values for P < 0.05. b, Approach to in silico deconvolution of synovial tissue using MCP-counter. c, MCP-counter scores for each cell type compared among CDAI 50% responders (R) and nonresponders (NR). Bar plots indicate nominal log10 P values for tocilizumab and –log10 P values for rituximab (two-sided Mann–Whitney test); dashed lines correspond to P = 0.05. Boxplots (right) show median and first and third quartiles, whiskers extending to the highest and lowest values. d–f, 16-week CDAI 50% response in patients stratified into B and T cell poor/rich (d) and macrophage/mDC poor/rich (e) according to median MCP-counter scores for individual cells (rich if above median, poor if below), or by combining B cell and macrophage/mDC scores from d,e (f). Exact P values shown when <0.05, two-sided Fisher's test comparing the proportions of responders to rituximab (in blue) and tocilizumab (in yellow). g–i, Longitudinal disease activity scores (CDAI), shown as mean ± s.d., for each month from baseline to 16 weeks for patients randomized to rituximab (in blue) or tocilizumab (in yellow) and classified as B and T cell poor/rich (g), macrophage/mDC poor/rich (h) and combined B cell/macrophage poor/rich (i). Comparison of CDAI between the two medications at individual time points by two-sided Mann–Whitney test, exact P values for <0.05 (adjustment for multiple comparisons by FDR). P values for the drug × time interaction term (two-way repeated-measures analysis of covariance) are shown when <0.05. c–i, n = 133 patients with baseline RNA-seq. NK, natural killer cells. mDC, myeloid dendritic cells.

