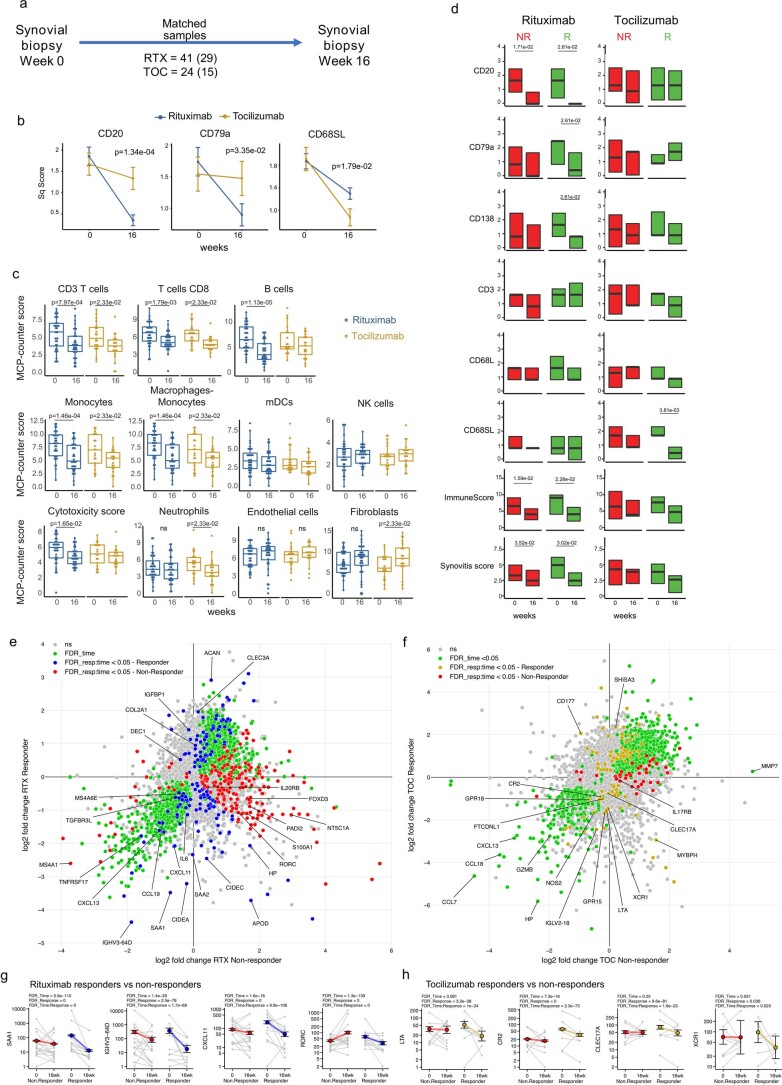
Extended Data Fig. 5. Longitudinal analysis of paired pre- and post-treatment synovial biopsies.
a, Schema showing an overview of longitudinal analysis of matched pre and post-treatment synovial biopsies, with number of samples for each medication (in brackets samples with available RNA-Seq). b, Semi-quantitative scores at baseline and 16 weeks in patients stratified according to treatment with rituximab (n = 41) or tocilizumab (n = 24). Mean ± SEM. Exact p values from two-sided analysis of covariance testing the difference in the changes from baseline between treatments, with treatment as factor and baseline score as covariate. c, MCP-counter scores in baseline and 16 weeks samples. Scatterplots showing individual samples and boxplots showing median and first and third quartiles, whiskers extending to the highest and lowest values no further than 1.5*interquartile range. Two-sided Wilcoxon signed-rank test (paired), comparing baseline and 16 weeks, adjusted for multiple testing by false discovery rate. n = 29 for rituximab and n = 15 for tocilizumab. d, Semi-quantitative scores of synovial immune cells at baseline and 16 weeks in patients treated with rituximab (n = 41) and tocilizumab (n = 24), stratified by CDAI50% response (NR = non responders, R = responders). Boxplots showing median and first and third quartiles. p values shown when <0.05, two sided Wilcoxon signed-rank test (paired) comparing baseline and 16 weeks, adjusted for multiple testing by false discovery rate. e,f, Longitudinal negative binomial mixed effects model on Rituximab (n = 29) and (f) Tocilizumab (n = 15) treated patients showing differential gene expression between responders and non-responders categorised by CDAI 50% response. Blue genes show greater absolute gene expression change in rituximab responders, yellow genes show greater absolute gene expression change in tocilizumab responders, while red genes showed greater absolute gene expression change in non-responders. g,h Scatter plots of representative genes with coloured points showing regression line of fitted negative binomial mixed effects model with error bars showing 95% confidence intervals (fixed effects) from analyses in e & f respectively. Grey points and lines show raw paired count data. n = 29 for rituximab and n = 15 for tocilizumab.

