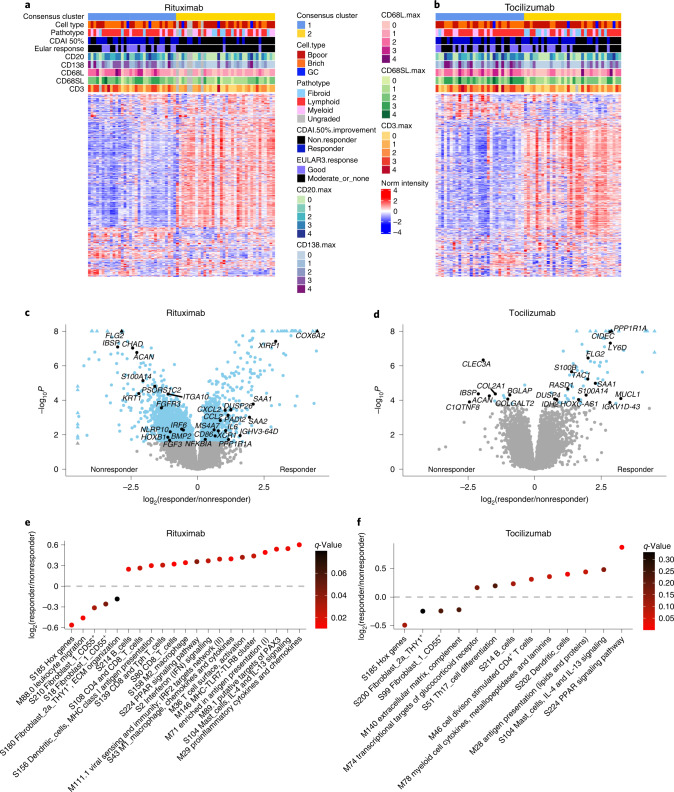
Fig. 2. Molecular signatures of response and nonresponse to rituximab and tocilizumab.
a,b, Monte Carlo reference-based consensus clustering of the 22,256 most variable genes identified a high-inflammatory-consensus cluster 1 (blue) and low-inflammatory cluster 2 (yellow). Heatmaps were produced for patients treated with rituximab (n = 68, a) and tocilizumab (n = 65, b) using Pearson’s distance metric and the complete linkage method using the ComplexHeatmap package in R. Upper tracks show consensus cluster, cell type (B cell rich/poor), the overall pathotype, CDAI 50% response, EULAR response and histological scores for CD20, CD138, CD68L, CD68SL and CD3. c,d, Volcano plots of DEGs using DESeq2 comparing CDAI 50% responders versus nonresponders to rituximab (c) and tocilizumab (d). Comparison between groups using Wald's test and correcting for multiple testing, Storey’s q-value (q < 0.05 significant, shown in blue). Positive and negative values represent upregulation and downregulation, respectively, in responders and nonresponders. e,f, Modular analysis applying QuSAGE to responders versus nonresponders to rituximab (e) and tocilizumab (f); log2 fold changes of responders (positive values) and nonresponders (negative values) are plotted for blood microarray-based modules12, with WGCNA modules summarized in one plot and dots color coded for their q-value.

