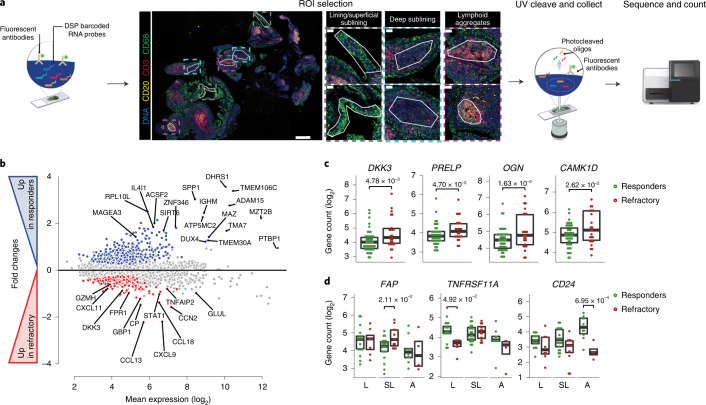
Fig. 4. DSP of refractory RA.
a, Scheme showing the approach to DSP, including selection of ROIs: CD68+ lining and superficial sublining, CD20–CD3– deep sublining and CD3+CD20+ lymphoid aggregates. b, MA plot showing mean expression (log2) on the x axis and fold change on the y axis comparing responders and refractory patients across all ROIs. Genes significantly upregulated (FDR<0.05) in responders are shown in blue (top), and those upregulated in refractory in red (bottom); in grey, genes with FDR > 0.05; P values were calculated using a negative binomial linear model applied to count data using DESeq2 (Wald test) and were FDR adjusted n = 12 patients, six ROIs per patient. c, Example of individual genes differentially expressed in refractory (red) or responders (green). Scatterplots showing individual ROIs, boxplots showing median and first and third quartiles. FDR-adjusted P values calculated as in b are shown for differentially expressed genes between refractory and responder individuals; n = 12 patients (4 responders to rituximab, 4 responders to tocilizimab and 4 refractory). d, Examples of individual genes differentially expressed in refractory (red) or responders (green) in different ROIs. Scatterplots showing individual ROIs (n = 12 patients, six ROIs per patient), boxplots showing median and first and third quartiles. FDR-adjusted P values calculated as in b are shown for differentially expressed genes between refractory and responder individuals. L, lining/superficial sublining; SL, deep sublining; A, lymphoid aggregates (as shown in a).

