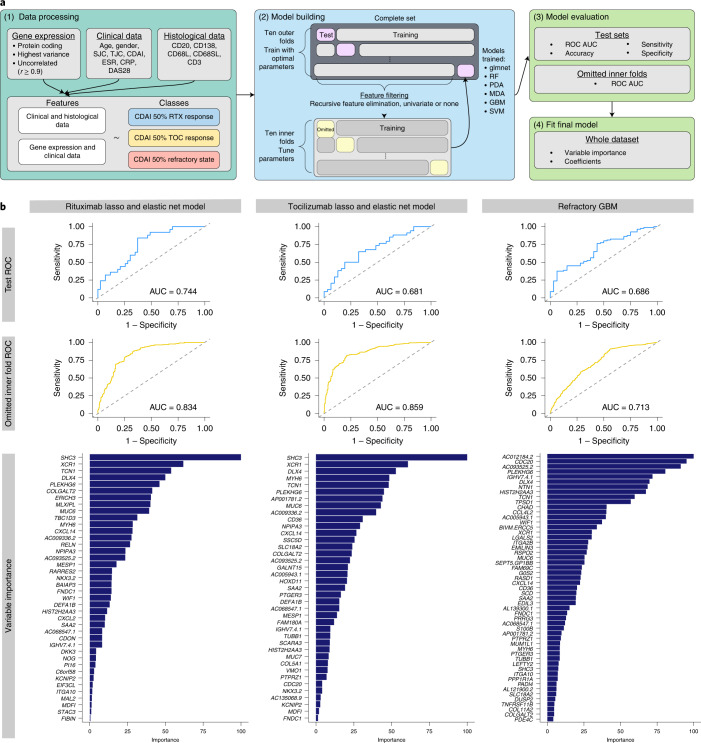
Fig. 6. Predictive models using nested ten-by-ten-fold cross-validation for response to rituximab and tocilizumab.
a, Machine learning pipeline utilized to predict CDAI 50% response to rituximab and/or tocilizumab using gene expression, clinical data and histological data as features (n = 133). Data processing (1) involved selection of protein-coding genes with the highest variance and removal of highly correlated genes. Data were split into ten inner and ten outer folds for building machine learning models (2). In models built using gene expression, RFE or univariate filtering was used to select the most important/predictive features for each model. Each model was evaluated on both the test set and the set omitted during cross-validation (3). Average tuned parameters from the outer folds were used to fit to the whole dataset to determine the importance of features selected for each model (4). b, Grid of plots showing optimal predictive models for different treatments (left, glmnet rituximab response prediction; middle, glmnet tocilizumab response prediction; right, GBM refractory response prediction) using gene expression and baseline clinical parameters as features. From top to bottom, plots show ROC curves for the best model on the test dataset (from outer fold), ROC curves on the omitted dataset (from inner fold) and variable importance when fit to the whole dataset.

