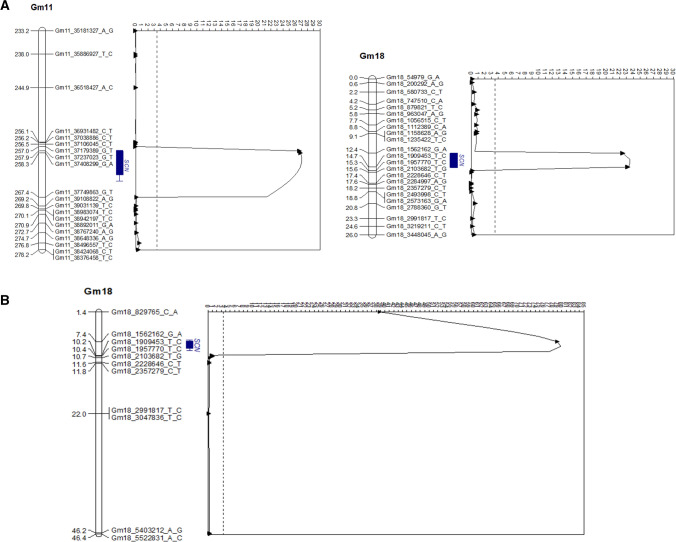
Fig. 3.
Quantitative trait loci (QTL) controlling soybean cyst nematode (SCN) resistance to TN22 (HG type 1.2.5.7) in PI 90763: A two major QTL detected in pop1 (SA13-1385 × PI 90763); B one major QTL detected in pop2 (LD11-2170 × PI 90763). Scales on the left of the chromosome represent the map position in centiMorgans (cM). Scales on the top of the graph represent the value of the logarithm of the odds (LOD). The black dotted line indicates the threshold of significance (LOD = 3.5 and 3.4) for pop1 and pop2, respectively

