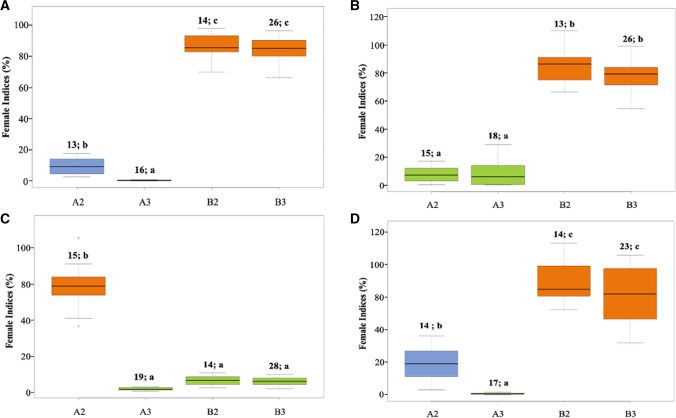
Fig. 6.
Phenotypic responses of lines carrying four allelic combinations from pop2 (LD11-2170 × PI 90763) tested against SCN populations A TN7(HG type 2.5.7; race 1), B TN22 (HG type 1.2.5.7; race 2), C PA3 (HG type 0; race 3), and D MM4 (HG type 2.5.7; race 5). The X-axis represents different allelic combinations of homozygous SCN resistance alleles/QTL. The numbers and letters above each box plot indicate the number of lines tested and significance grouping based on Tukey's test (Tukey's HSD) at P ≤ 0.05

