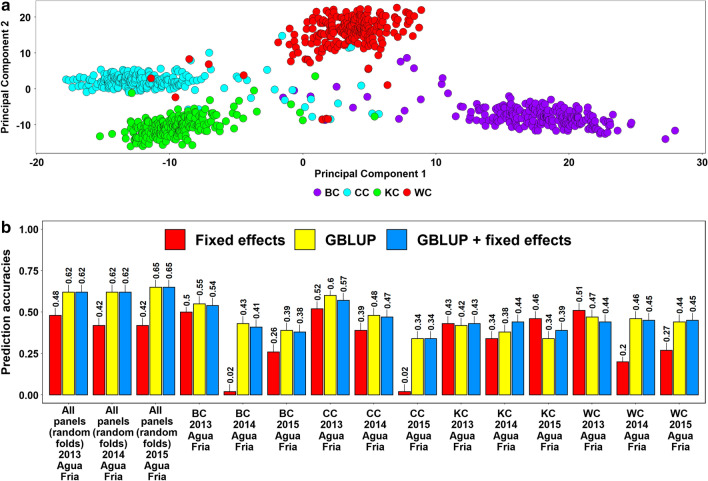
Fig. 5.
a Population structure in the sibs panels indicated by the principal components 1 and 2. BC refers to the Bartai x CianoT79 population, CC refers to the Cascabel × Ciano T79 population, KC refers to the Kath x Ciano T79 population and WC refers to the Wuya x Ciano T79 population. b Prediction accuracies across the half-sibs panels evaluated between 2013 and 2015 in Agua Fria using the fixed effects model (with selected spot blotch associated markers as fixed effects), the genomic best linear unbiased prediction (GBLUP) model and the GBLUP + fixed effects model (GBLUP + fixed effects). The prediction accuracies for random folds indicate the fivefold cross validation accuracies when 182 random full-sibs and half-sibs were predicted from the remaining 730 full-sibs and half-sibs. In prediction across half-sibs panels, all other half-sibs panels comprising 681–688 lines were used to predict a given panel with 224–231 full-sibs

