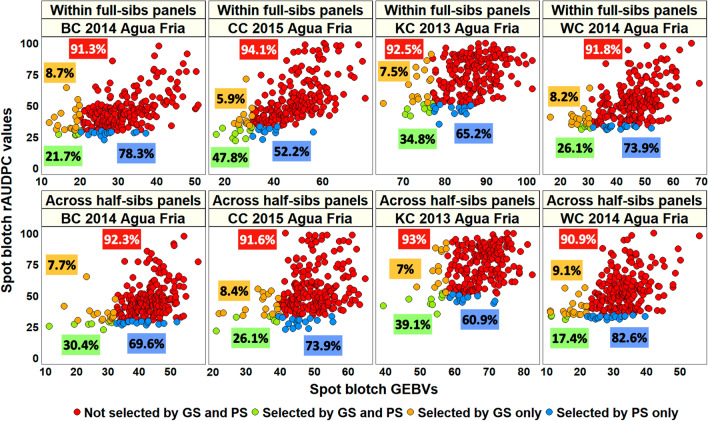
Fig. 7.
Comparison of phenotypic selection (PS) for spot blotch using the relative area under the disease progress curve (rAUDPC) values with genomic selection (GS) using the genomic estimated breeding values (GEBVs) obtained from the genomic best-linear unbiased prediction model in predictions within full-sibs panels and across-half sibs panels. BC refers to the Bartai x Ciano T79 population, CC refers to the Cascabel x Ciano T79 population, KC refers to the Kath x Ciano T79 population and WC refers to the Wuya x Ciano T79 population. Among the lines that were discarded by PS, the percentages of lines that were not selected by GS and PS among the discarded lines are given in red boxes and the percentages of lines that were selected by GS only are given in orange boxes. Among the lines that were selected by PS, the percentages of lines that were selected by GS and PS are given in green boxes and the percentages of lines that were selected by PS only are given in blue boxes

