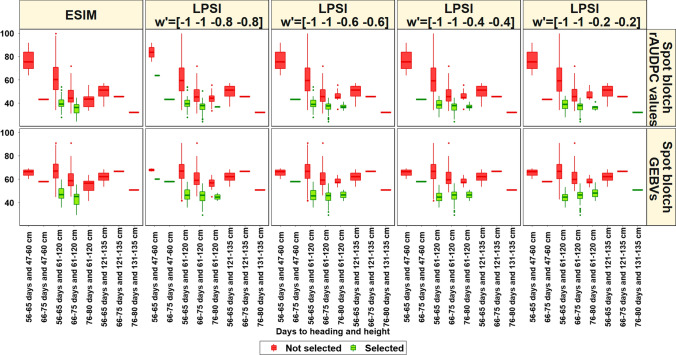
Fig. 8.
Box plots showing the distribution of spot blotch relative area under the disease progress curve (rAUDPC) values and genomic-estimated breeding values (GEBVs), days to heading and plant height for the 10% of the half-sibs that were selected using the Eigen selection index method (ESIM) and the linear phenotypic selection index (LPSI) and the remaining lines that were not selected. The different vectors of arbitrary weights (w′) used in the LPSI index for spot blotch rAUDPC values, GEBVs, days to heading and plant height, respectively were w′= [− 1 − 1 − 0.8 − 0.8], w' = [− 1 − 1 − 0.6 − 0.6], w′= [− 1 − 1 − 0.4 − 0.4] and w′= [− 1 − 1 − 0.2 − 0.2]

