Fig. 2.
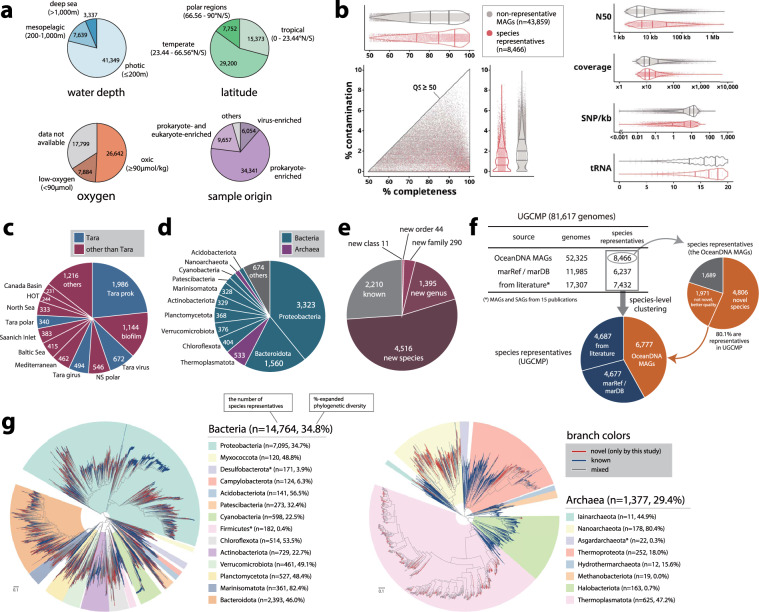
Origin, quality, and novelty of the OceanDNA MAGs. (a) Origin of the OceanDNA MAGs. Types of the fraction were described in the main text. (b) Genome statistics for species representatives and non-representatives. Lines in violin plots indicate quartiles that were estimated based on density profiles. (c) Origin of metagenome divisions of the 8,466 species representatives. (d) Phyla of the species representatives assigned by GTDB-Tk. (e) The potential taxonomic novelty of the species representatives assessed using GTDB-Tk. (f) Origins and compositions of the unified catalog UGCMP and the species representatives. (g) Bacterial (left) and archaeal (right) phylogenetic trees of the species representatives of UGCMP. The trees were midpoint rooted for visualization purposes. The number of species representatives and %-expanded phylogenetic diversity was described for individual phyla, of which the number of species was at least 100 for bacteria and 10 for archaea. These phyla were highlighted in the trees with the corresponding colors. If a phylum was not monophyletic in the trees, only the largest monophyletic unit was highlighted (three phyla represented by asterisks in the legend). Note that %-expanded phylogenetic diversity was estimated using all the genomes of UGCMP (not limited to the species representatives). Source data is available in Supplementary File S3.

