Abstract
Aberrant expression of long non-coding RNAs (lncRNAs), caused by alterations in DNA methylation, is a driving factor in several cancers. Interplay between lncRNAs’ aberrant methylation and expression in prostate cancer (PC) progression still remains largely elusive. Therefore, this study characterized the genome-wide epigenetic landscape and expression profiles of lncRNAs and their clinical impact by integrating multi-omics data implementing bioinformatics approaches. We identified 62 differentially methylated CpG-sites (DMCs) and 199 differentially expressed lncRNAs (DElncRNAs), where 32 DElncRNAs contain 32 corresponding DMCs within promoter regions. Significant negative correlation was observed between 8 DElncRNAs-DMCs pairs. 3 (cg23614229, cg23957912, and cg11052780) DMCs and 4 (CACNA1G-AS1, F11-AS1, NNT-AS1, and MSC-AS1) DElncRNAs were identified as high-risk factors for poor prognosis of PC patients. Overexpression of hypo-methylated CACNA1G-AS1, F11-AS1, and NNT-AS1 and down-regulation of hyper-methylated MSC-AS1 significantly lower the survival of PC patients and could be a potential prognostic and therapeutic biomarker. These DElncRNAs were found to be associated with several molecular functions whose deregulation can lead to cancer. Involvement of these epigenetically deregulated DElncRNAs in cancer-related biological processes was also noticed. These findings provide new insights into the understanding of lncRNA regulation by aberrant DNA methylation which will help to clarify the epigenetic mechanisms underlying PC.
Subject terms: Cancer, Computational biology and bioinformatics
Introduction
Prostate cancer (PC) is the second most commonly diagnosed cancer in males globally accounting for 1,276,106 new cases and 358,989 deaths (3.8% of all cancer-related deaths in men) in 20181. However 2,293,818 additional cases are expected till 2040 and there will also be a minor difference in mortality (an increase of 1.05%)2. This indicates that despite the majority of PC patients experiencing a slow tumor progression, a certain percentage of the cases discovered are more aggressive and lethal cancer variants3.
The earlier studies on PC were condensed on suggesting a significant heterogeneity in structural alterations of the genome-such as the variations in DNA copy numbers, the electron transport system (ETS) of transcription factors causing genetic fusions within the tumors and in gene expression profiles which were found in around half of the prostate tumors4–12. The diversity in genomic expressions and variations in the tumor behavior in cases of PC were attributed to some other factors involving genomic aberrations13. Epigenetic alterations have been more immediately charged with being responsible as an early event leading up to further somatic and genetic mutation in several tumors14. The event of DNA methylation is one of the most popularly studied epigenomic changes15 that have been found to regulate gene expression, thereby impacting tumorigenesis and cancer progression16–22 in both metastatic and locally advanced tumors23,24. About 60% of human gene promoters have been reported to be overlapped with CpG islands (CGIs)25—the small clusters of residues where DNA methylation occurs26. Such affiliation of the CGI with the DNA promoters leads to methylation of the promoter regions of the DNA which ultimately ends up in gene silencing27. The simple mechanism for the process can be summed up as methylation of the 5′ carbon of cytosine in CGIs of gene promoters. Any alteration in DNA methylation processes can lead to cancer initiation, progression, invasion and metastasis28,29.
Noncoding RNA, earlier regarded as ‘transcriptional noise’ of the genome, has successively acquired the recognition for its important functional involvement in a variety of biological processes, including gene expression regulation, alternative splicing regulation, cellular structure formation, and so on30,31. Long non-coding RNAs containing more than 200 nucleotides in length are also members of non-coding RNAs which have recently emerged as a class of tumor-suppressor and oncogenic genes32,33. The effects of lncRNAs on carcinogenesis may be performed through the process of transcriptional, post-transcriptional and epigenetic modification33. Aberrant expression of lncRNA contributes to the development and progression of cancers which demonstrate the potential role of lncRNAs as novel diagnostic and prognostic biomarkers for cancer and therapeutic targets as well34,35. MiRNAs, another member of non-coding RNAs, have been extensively investigated to identify miRNA/miRNA-targeted signatures to improve the diagnosis and prognosis of several cancers36–40. Emerging evidences have documented the superiority of lncRNA as diagnostic and prognostic biomarkers for cancers compared to miRNAs29,41,42. However, the detailed function of lncRNAs in development and progression of cancer is still unknown43. Therefore, concurrent studies have also shown how DNA methylation of lncRNA-encoding genes can affect the downstream targets29.
The hyper-methylation of the CGIs in some of the tumor suppressor genes has been frequently noticed in cases of PC tumors as well44,45. Previous studies on DNA methylation in PC fundamentally used the CpG islands array on either the thousands of genomic regions around the methylation site or the promoter regions46,47. However, interrelation between the DNA methylation and the lncRNA expression in PC still remain largely unknown. In this present study, a genome-wide integrated analysis between the DNA methylation and the expression of lncRNA was performed to characterize the correlation between the DNA methylation and lncRNA regulation, thereby figure out the epigenetically regulated lncRNAs. Moreover, potential clinical relevance of these epigenetically regulated lncRNAs with the PC patients’ survival was also investigated. Further to that, molecular functions of these lncRNAs along with the biological processes in which they are involved were also elucidated.
Results
Characterization of DNA methylation pattern in prostate cancer
We conducted a differential methylation analysis and long non-coding RNAs (lncRNA) annotation to identify the differentially methylated CpG sites (DMCs) in prostate cancer patients which are located in the promoter regions of lncRNAs. Regarding this, initially, we obtained 23 methylation array data series from the GEO database among a total of 2030 data series for Prostate cancer. Among the 23 methylation array data series, an independent methylation cohort GSE112047 (contains 31 tumor and 16 control samples) satisfied all the inclusion criteria specified in the method and selected for differential methylation analysis. We then computed differential methylation patterns between 31 tumor and 16 control samples and identified a total of 18,066 CpG sites where 2622 were identified with FDR < 0.05 (Fig. 1a). From this figure, it can be noticed that the CpG sites are distributed in all the chromosomes. 566 of the 2622 CpG sites were found to localize in the lncRNA promoter regions and designated for assessing the DNA methylation alterations within the lncRNA promoter regions (Table S1). Methylation distribution (beta value) of the 566 CpG sites in lncRNA promoter regions manifested a relatively higher methylation density at the distal regions of the lncRNA promoter regions than at Transcription Start Site (TSS) (Fig. 1b). Among the 566 CpG sites, 62 were identified to have an absolute delta-beta value > 0.2 and considered as DMCs. Besides, with a 0.2 cut off size, 6 differentially methylated regions (DMRs) were identified among a total of 340 methylated regions. TCGA (PRAD)-450k methylation array was used to validate the DNA methylation patterns of the 566 CpG sites and found consistency with our results.
Figure 1.
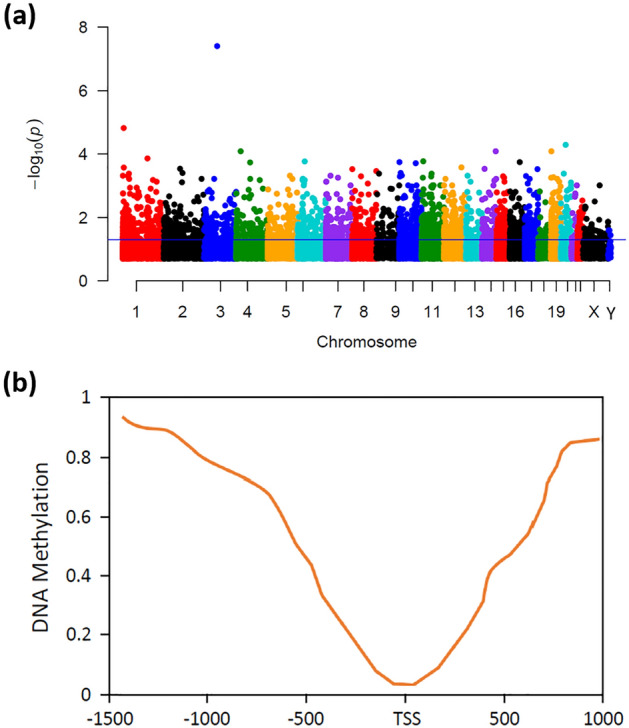
DNA methylation pattern of the CpG sites in prostate cancer. (a) Distribution of the CpG sites across the chromosomes. The horizontal straight line (blue) represents the 10−1.3 (0.05) threshold on the p value. CpG sites that cross the threshold value are considered significant. (b) Methylation distribution around the lncRNAs ranging from 1.5 kb upstream to 1 kb downstream of the transcription start site (TSS). Y-axis represents the beta values of the identified CpG sites in Prostate cancer.
Characterization of differentially expressed lncRNAs in prostate cancer
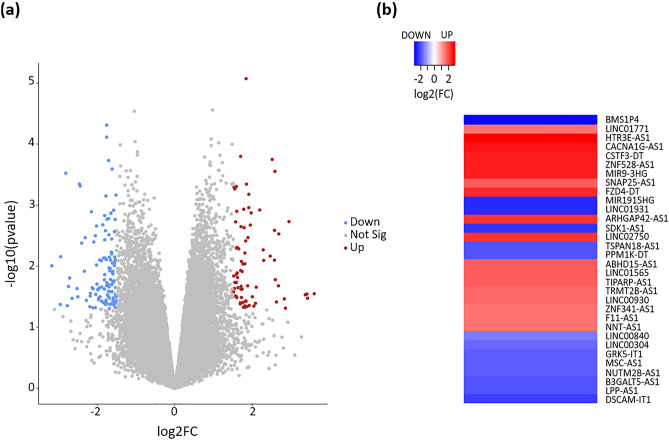
To identify the differentially expressed lncRNAs, an independent lncRNA cohort GSE140927 (contains 4 tumor and 4 control samples) was retrieved from the GEO database amongst a total of 114 non-coding RNA data series. This analysis identified 26,246 lncRNAs after removing the duplicates and the Circular RNAs (circRNAs) from the list. 199 (78 up-regulated and 121 down-regulated) of the 26,246 lncRNAs were identified with P-value < 0.05 and |log2FC| > 1.5 and considered as significant and differentially expressed lncRNA (DElncRNA) (Fig. 2a). Further to that, 32 (18 up-regulated and 14 down-regulated) (Fig. 2b) out of 199 DElncRNAs were sorted as they contain corresponding 32 (out of 62) DMCs (identified in the previous step) within their promoter regions (Table S2). Moreover, these 32 DElncRNAs were categorized based on their position in the genome and found that these DElncRNAs were at four categories of different genomic locations, i.e. antisense RNA, Long intergenic non-coding RNA, divergent transcript, and intronic transcript. Antisense RNA, long intergenic non-coding RNA, divergent transcript, and intronic transcript were accounted for 17, 10, 3, and 2, respectively.
Figure 2.
Differential expression signature of lncRNAs in prostate cancer. (a) Volcano plot shows the expression pattern of the lncRNAs in Prostate cancer. The red and blue dots indicate the significantly (p-value < 0.05) up-regulated (log2FC > 1.5) and down-regulated (log2FC < − 1.5) lncRNAs, respectively. (b) Heatmap shows the differentially expressed lncRNAs whose promoter region gets methylated differentially in Prostate cancer. The red and blue bars respectively represent the significantly (p-value < 0.05) up-regulated (log2FC > 1.5) and down-regulated (log2FC < − 1.5) lncRNAs.
Correlation analysis between the DElncRNAs and the corresponding DMCs
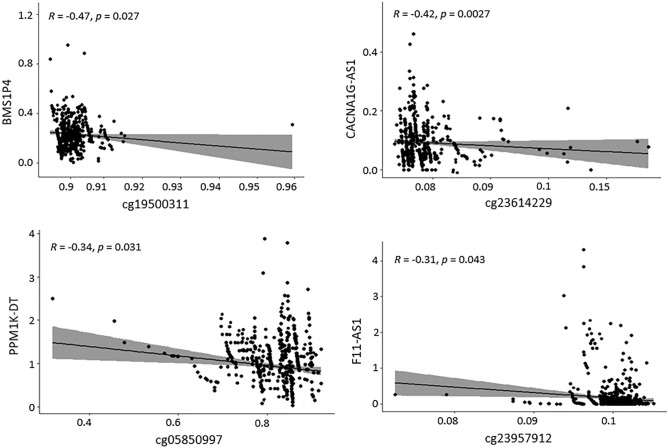
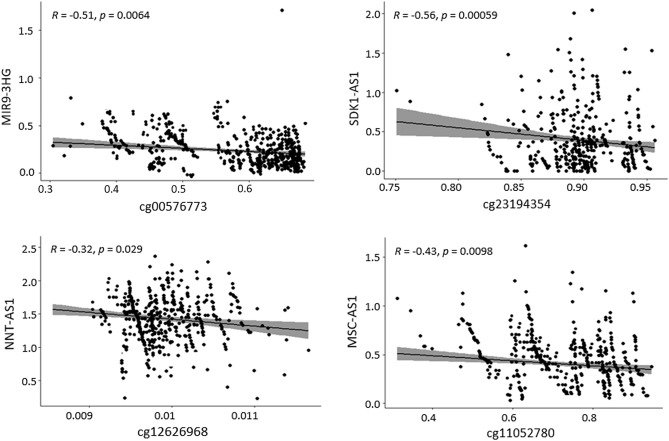
We combined the expression pattern of the DElncRNAs and the methylation pattern of the DMCs to determine whether the expression of the 32 DElncRNAs is modulated by the methylation of the corresponding 32 CpG sites. Concerning this, we performed Spearman's correlation analysis between these 32 pairs (DElncRNAs-DMCs) omics data and found 24 negatively and 8 positively correlated pairs (Table S3). Out of 24 pairs, a significant negative correlation [correlation coefficient (R) > − 0.3 and p-value < 0.05] was observed between the 8 DElncRNA (BMS1P4, CACNA1G-AS1, MIR9-3HG, SDK1-AS1, PPM1K-DT, F11-AS1, NNT-AS1, and MSC-AS1) and their respective 8 DMCs (cg19500311, cg23614229, cg00576773, cg23194354, cg05850997, cg23957912, cg12626968, and cg11052780) (Figs. 3 and 4). The down-regulation of BMS1P4, SDK1-AS1, PPM1K-DT, and MSC-AS1 was significantly associated with the hyper-methylation of their respective CpG sites cg19500311, cg23194354, cg05850997, and cg11052780 which were found within the promoter region of these DElncRNAs. Conversely, the up-regulation of CACNA1G-AS1, MIR9-3HG, F11-AS1, and NNT-AS1 is significantly associated with the hypo-methylation of their respective CpG sites cg23614229, cg00576773, cg23957912, and cg12626968 which were found within the promoter region of these DElncRNAs.
Figure 3.
Correlation between the DMCs (cg19500311, cg23614229, cg05850997, and cg23957912) and the expression of lncRNAs (BMS1P4, CACNA1G-AS1, PPM1K-DT, and F11-AS1) in matched samples. The beta values of the DMCs are depicted in X-axis and the expression (FPKM) values of lncRNAs are depicted in Y-axis. R and p indicate the Spearman's correlation coefficient and the p-values derived from Spearman's correlation, respectively.
Figure 4.
Correlation between the DMCs (cg00576773, cg23194354, cg12626968, and cg11052780) and the expression of lncRNAs (MIR9-3HG, SDK1-AS1, NNT-AS1, and MSC-AS1) in matched samples. The beta values of the DMCs are depicted in X-axis and the expression (FPKM) values of lncRNAs are depicted in Y-axis. R and p indicate the Spearman's correlation coefficient and the p-values derived from Spearman's correlation, respectively.
A consequence of aberrant DNA methylation and expression of DElncRNA on the survival of prostate cancer patients
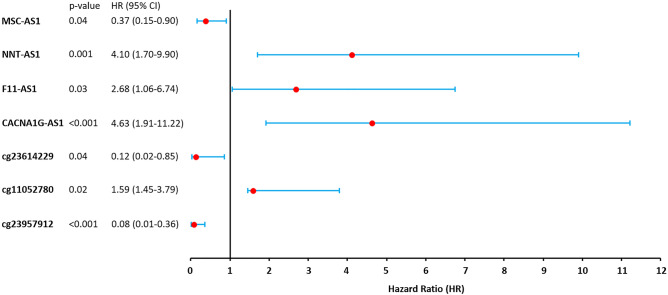
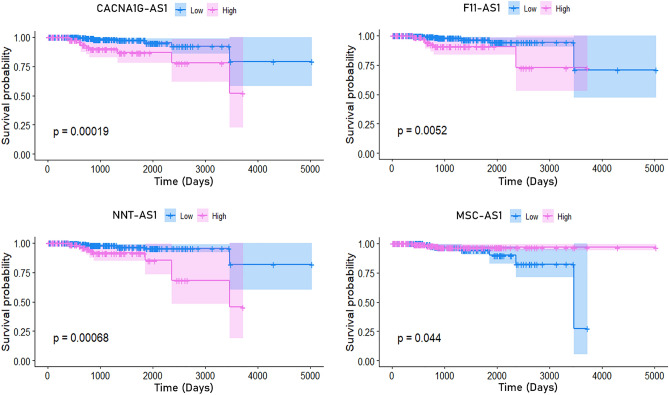
The methylation pattern of the 8 DMCs and the expression of the 8 DElncRNAs in prostate cancer patients were evaluated to determine their impact on the patient’s survival. Univariate Cox regression analysis identified 3 (cg23614229, cg23957912, and cg11052780) DMCs and 4 (CACNA1G-AS1, F11-AS1, NNT-AS1, and MSC-AS1) DElncRNAs as high-risk factors (95% CI HR ⊉ 1 and p-value < 0.05) for the prognosis of patients with Prostate cancer (Fig. 5). Hypo-methylation of two DMCs cg23614229 (within the promoter region of CACNA1G-AS1), and cg23957912 (within the promoter region of F11-AS1) were found to significantly responsible for the poor prognosis of the patients with Prostate cancer (95% CI HR < 1 and p-value < 0.05). Conversely, hyper-methylation of the cg11052780 (within the promoter region of MSC-AS1) probe was found to have significant effect on poor prognosis of the patients with Prostate cancer (95% CI HR > 1 and p-value < 0.05) (Fig. 5). Higher expression (95% CI HR > 1) of CACNA1G-AS1, F11-AS1, and NNT-AS1 were found to significantly lower the overall survival rates of the patients with Prostate cancer than those of patients with lower expression of these DElncRNAs (Figs. 5 and 6). On the contrary, poor overall survival was remarked for the patients with low expression (95% CI HR < 1) of MSC-AS1 compared with patients with high expression of MSC-AS1 (Figs. 5 and 6). To avoid the dependency only on the expression of DElncRNAs, additionally, multivariate Cox regression analysis was also done by adjusting other covariates (patients age and primary Gleason grade) with the DElncRNAs’ expression and the results still showed that the expression of these 4 DElncRNAs was significantly correlated with poor survival (95% CI HR ⊉ 1 and p-value < 0.05) of the patients with Prostate cancer (Table 1).
Figure 5.
Forest plot showing the correlation between the methylation of DMCs and expression of DElncRNAs with the overall survival of the Prostate cancer patients. Median beta value for the DMCs and the median FPKM value for the lncRNAs were considered as cut-off value.
Figure 6.
Overall survival analysis of the patients with prostate cancer based on the expression of CACNA1G-AS1, F11-AS1, NNT-AS1, and MSC-AS1. Median FPKM value was considered as cut-off value.
Table 1.
Cox regression analysis (univariate and multivariate) of the variables associated with the overall survival of the prostate cancer patients.
| Variables | Univariate Cox regression analysis | Multivariate Cox regression analysis | ||||
|---|---|---|---|---|---|---|
| Hazard ratio (HR) | 95% confidence interval (CI) | P-value | Hazard ratio (HR) | 95% confidence interval (CI) | P-value | |
| Age (> 61/ < 61) | 1.15 | 0.83–1.62 | 0.01 | 1.59 | 1.11–2.26 | 0.01 |
| Primary Gleason grade (Pattern 3 + Pattern 4 + Pattern 5) | 1.23 | 0.69–2.25 | 0.02 | 1.79 | 1.14–2.80 | 0.04 |
| CACNA1G-AS1 (high expression/low expression) | 4.63 | 1.91–11.22 | < 0.001 | 6.02 | 1.70–21.86 | 0.04 |
| F11-AS1 (high expression/low expression) | 2.68 | 1.06–6.74 | 0.03 | 5.09 | 3.08–8.33 | 0.03 |
| NNT-AS1 (high expression/low expression) | 4.10 | 1.70–9.90 | 0.001 | 4.33 | 2.62–7.98 | 0.001 |
| MSC-AS1 (high expression/low expression) | 0.37 | 0.15–0.90 | 0.04 | 0.32 | 0.12–0.83 | 0.01 |
Functional enrichment analysis
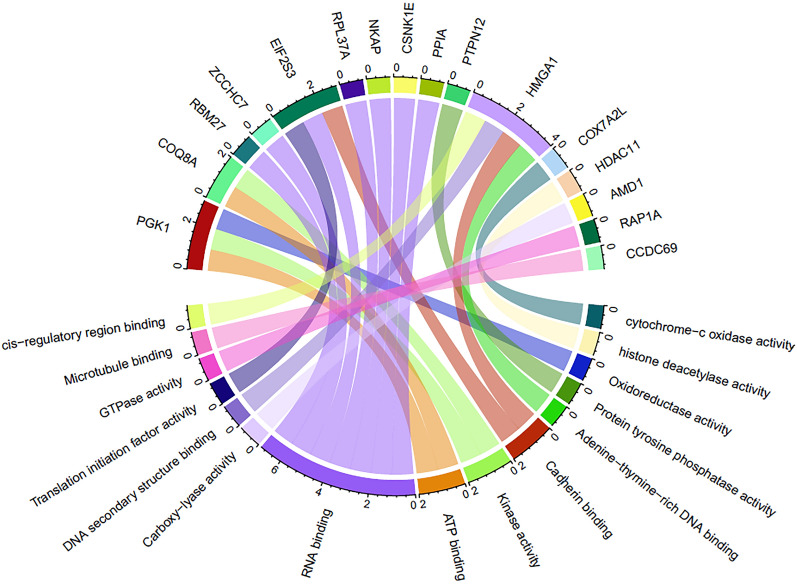
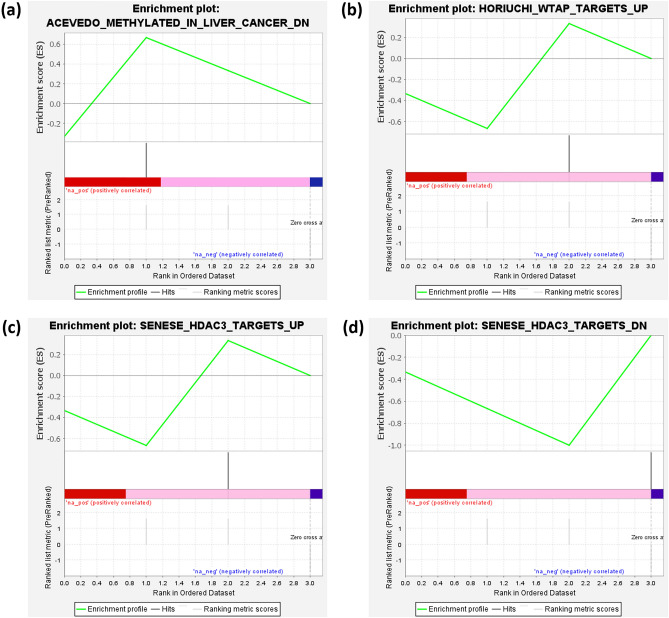
Functional enrichment analysis was accomplished to identify the potential molecular functions and the underlying biological processes in which CACNA1G-AS1, F11-AS1, NNT-AS1, and MSC-AS1 are involved. In terms of this, lncRNA-mRNA interaction network was determined to figure out the protein-coding genes whose expression can be modulated by the CACNA1G-AS1, F11-AS1, NNT-AS1, and MSC-AS1 lncRNAs. This analysis identified a total of 30 protein-coding genes, 18 of which can be modulated by the NNT-AS1, whereas MSC-AS1, and CACNA1G-AS1 can modulate 9, and 3 protein-coding genes, respectively (Fig. 7). We did not find any protein-coding gene associated with the F11-AS1. These 30 protein-coding genes were assigned for characterizing their molecular functions and only 16 protein-coding genes were found to have significant (P-value < 0.05) association with several molecular functions (Fig. 8). NNT-AS1 targeted RBM27, RAP1A, AMD1, PTPN12, HMGA1, CCDC69, ZCCHC7, COQ8A, PPIA and CSNK1E genes were pointed out to involve in RNA binding, GTPase activity, carboxy-lyase activity, protein tyrosine phosphatase activity, cis-regulatory region binding, DNA secondary structure binding, cadherin binding, adenine–thymine rich DNA binding, Microtubule binding, kinase activity, and ATP binding (Fig. 8). RNA binding, cytochrome-c-oxidase activity, ATP binding, kinase activity, oxidoreductase activity, translation initiation factor activity, and cadherine binding molecular functions were found to actualize by the MSC-AS1 targeted NKAP, COX7A2L, PGK1, EIF2S3 genes (Fig. 8). CACNA1G-AS1 targeted RPL37A, HDAC11 genes were identified to associate with RNA binding, and histone deacetylase activity (Fig. 8). Additionally, gene set enrichment analysis (GSEA) was executed to identify the biological processes in which these lncRNAs are involved. A functionally unknown lncRNA, F11-AS1, was explored and found that F11-AS1 positively correlated with the ACEVEDO_METHYLATED_IN_LIVER_CANCER_DN set, means up-regulation of the F11-AS1 positively correlates with the hypo-methylation of the genes associated in liver cancer (Fig. 9a). CACNA1G-AS1 negatively correlated with the HORIUCHI_WTAP_TARGETS_UP set, means down-regulation of the CACNA1G-AS1 negatively correlates with the up-regulation of the Wilms' tumor 1-associating protein (WTAP) targeted genes (Fig. 9b). The “SENESE_HDAC3_TARGETS_DN” set is enriched in the NNT-AS1 low expression group which suggests that the downregulation of this lncRNA negatively correlates with the downregulation of Histone Deacetylase 3 (HDAC3) targeted genes (Fig. 9c). MSC-AS1 negatively correlated with the SENESE_HDAC3_TARGETS_UP set which indicates that the downregulation of this lncRNA negatively correlates with the up-regulation of HDAC3 targeted genes (Fig. 9d).
Figure 7.
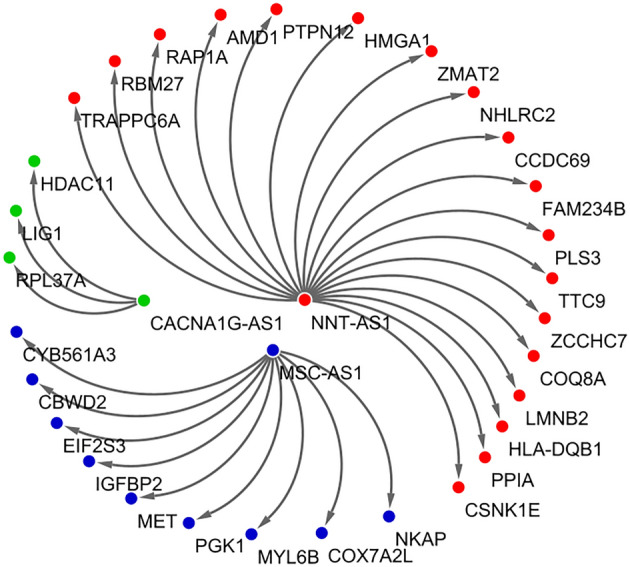
lncRNA-mRNA interaction network showing protein-coding genes targeted by the CACNA1G-AS1, NNT-AS1, and MSC-AS1.
Figure 8.
Gene ontology (GO)-molecular function (MF) analysis of the CACNA1G-AS1, NNT-AS1, and MSC-AS1 targeted protein-coding genes.
Figure 9.
Gene set enrichment analysis (GSEA) exhibiting the biological process associated with the (a) F11-AS1, (b) CACNA1G-AS1, (c) NNT-AS1, and (d) MSC-AS1. A positive enrichment score represents positive correlation with the phenotype profile where a negative score represents inverse correlation with the phenotype profile. Red, pink and blue color indicate the high, moderately high, and low expression.
Discussion
A relatively new ncRNA class, lncRNAs, have been characterized as an important kind of gene expression regulator and can play crucial roles in carcinogenesis48. In recent years, lncRNAs have become a research hotspot for study in a variety of cancer fields. It has already been demonstrated that the lncRNAs are shedding new insight into understanding the cancer pathways and their potential role as novel diagnostic and predictive cancer biomarkers in clinical practice49,50. Aberrant expression of lncRNAs has also been found to be associated with prostate cancer (PC) emergence and progression, and several lncRNAs have been identified as diagnostic and predictive biomarker for PC51,52. Emerging evidence indicates that methylation of DNA is a key epigenetic regulator of the expression of lncRNAs, and epigenetic alterations might interfere with the lncRNAs expression profile which can promote cancer53–55. However, interrelation of the aberrant methylation in the promoters of lncRNAs with the emergence and progression of PC still remains largely elusive. Therefore, in this present study, we conducted an integrated analysis of DNA methylation and the expression of lncRNAs to characterize the dysregulated lncRNAs in the development and progression of PC. Furthermore, we explored the interplay between the biological and clinical relationships of the lncRNAs with the prognosis of PC patients.
A genome-wide methylation alteration was observed in lncRNA promoter regions which revealed a relative reduction of the methylation density at the TSS during the development and progression of PC. Mapping of the aberrant DNA methylation to the promoter regions of lncRNAs identified a total of 32 epigenetically deregulated DElncRNAs in PC, where 18 and 14 were found to be up-regulated and down-regulated, respectively. A significant inverse correlation was found between the promoter methylation (cg19500311, cg23614229, cg00576773, cg23194354, cg05850997, cg23957912, cg12626968, and cg11052780) of 8 corresponding aberrantly expressed DElncRNAs (BMS1P4, CACNA1G-AS1, MIR9-3HG, SDK1-AS1, PPM1K-DT, F11-AS1, NNT-AS1, and MSC-AS1). DNA methylation in promoters is inversely correlated with the corresponding gene expression56. The hyper-methylation of CpG sites cg19500311, cg23194354, cg05850997, and cg11052780 significantly lower the expression of the corresponding BMS1P4, SDK1-AS1, PPM1K-DT, and MSC-AS1 lncRNAs. Conversely, significant up-regulation of the CACNA1G-AS1, MIR9-3HG, F11-AS1, and NNT-AS1 lncRNAs is caused by the hypo-methylation of the respective CpG sites cg23614229, cg00576773, cg23957912, and cg12626968. These DElncRNAs were divided into two groups based on their methylation patterns and expression levels to distinguish PC patients with different prognoses and thereby demonstrate a potential function of the anomalously methylated DElncRNAs in the survival of PC patients. From an integrated analysis of multi-omics and clinical data, prognosis prediction is a key factor for understanding the biological complexity of PC. The cg23614229, cg23957912, and cg11052780 DMCs and the CACNA1G-AS1, F11-AS1, NNT-AS1, and MSC-AS1 DElncRNAs were identified as significant high-risk factors for the poor prognosis of PC patients. Higher expression of the hypo-methylated CACNA1G-AS1, F11-AS1, and NNT-AS1 significantly lower the overall survival rates of the PC patients. CACNA1G-AS1 was demonstrated to have significantly higher expression in several cancer, such as ovarian cancer and non-small cell lung cancer57,58. Pre-ranked GSEA analysis showed that the high expression of CACNA1G-AS1 might be associated with the up-regulation of the Wilms’ tumor 1-associating protein (WTAP) targeted genes. Overexpression of WTAP contributes to aggressive features of numerous cancers such as renal cell carcinoma, acute myeloid leukemia, diffuse large B-cell lymphoma, cholangiocarcinoma, hepatocellular carcinoma and play a role as oncogene59–63. Previous studies also showed the higher expression of NNT-AS1 in numerous cancers such as cholangiocarcinoma, osteosarcoma, non-small cell lung cancer, colorectal cancer, including prostate cancer64–68. The increased expression of NNT‑AS1 positively correlates with the up-regulation of Histone Deacetylase 3 (HDAC3) targeted genes as predicted by the GSEA analysis. Previous findings showed that the overexpression of HDAC3 acts as an oncogenic feature and can promote the progression of cholangiocarcinoma and gastric cancer69,70. Unlike CACNA1G-AS1 and NNT‑AS1, the up-regulation of F11-AS1 has been found to be associated with the suppression of liver hepatocellular carcinoma71,72. GSEA analysis revealed that up-regulation of the F11-AS1 was likely to be associated with the hypo-methylation of the genes associated in liver cancer. As up-regulation of F11-AS1 significantly lower the overall survival of PC patients, its overexpression feature could be a potential diagnostic and prognostic biomarker for PC. Low expression of hyper-methylated MSC-AS1 significantly lower the overall survival of the patients with PC. As GSEA results predicted, the down-regulation of MSC-AS1 might be involved in the up-regulation of Histone Deacetylase 3 (HDAC3) targeted genes. Function enrichment analysis of mRNAs regulated by these four epigenetically deregulated lncRNAs uncovers a new perception of the potential functional relevance of these DElncRNAs. We found that these DElncRNAs are involved in many molecular functions such as RNA binding, GTPase activity, protein tyrosine phosphatase activity, DNA secondary structure binding, cadherin binding, kinase activity, cytochrome-c-oxidase activity, translation initiation factor activity, and histone deacetylase activity. Deregulation of such molecular functions can result in several disease conditions including but not limited to cancer73–77. Hence, aberrant expression of these epigenetically deregulated lncRNAs might cause the distortion of these cellular functions which can lead to the emergence and progression of PC.
The results provide by the current study is an evidence of the genome-wide alteration of DNA methylation of lncRNAs in PC patients. The candidate epigenetically deregulated lncRNAs CACNA1G-AS1, F11-AS1, NNT-AS1, and MSC-AS1 might function as key regulatory factors in the development and progression of PC and could be potential therapeutic and prognostic biomarkers for PC, which were associated with the poor prognosis of the patients with PC. The present results will help to unravel a more detailed understanding of the aberrant methylation patterns of lncRNAs and thereby clarify the epigenetic mechanisms underlying PC.
Conclusion
The current study investigated the crosstalk between the DNA methylation and expression of lncRNAs and their impact on the clinical prognosis of PC patients by integrating multi-omics data using several bioinformatics approaches. The establishment of a detailed understanding of DNA methylation-altered CACNA1G-AS1, F11-AS1, NNT-AS1, and MSC-AS1 lncRNAs in PC will facilitate the characterization of oncogenic lncRNAs. The mechanistic and functional characterization of these epigenetically deregulated lncRNAs may help to reveal the path of future development of lncRNA-based PC specific therapies. The significant prognostic association of CACNA1G-AS1, F11-AS1, NNT-AS1, and MSC-AS1 lncRNAs suggests their association in PC progression which will shed light on the future development of lncRNA-based prognostic biomarkers specific for PC. Since the results provided by this present study are based on in silico analysis, further in-depth experimental investigations are required to validate the findings.
Methods
Characterization of DNA methylation pattern in prostate cancer
A differential methylation analysis and long non-coding RNAs (lncRNA) annotation was performed to identify the prostate cancer (PC) related differentially methylated CpG sites (DMCs) and differentially methylated regions (DMRs) located in the promoter regions of lncRNAs. The GEO (Gene Expression Omnibus) database78 was explored to search for methylation array datasets for prostate cancer. This database is the most widely used public repository for accessing raw, processed, and descriptive gene expression data, as well as other functional genomics data sets including genome methylation, genome variation and genome-protein interaction78. The keyword “prostate cancer” was used for this search and then considered the following criteria for choosing the appropriate datasets (i) the methylation array dataset were restricted to “Homo sapiens”, (ii) the experiment type was specified to “Methylation profiling by array”, (iii) dataset having tumor and control samples, (iv) “Illumina HumanMethylation450 BeadChip” was nominated as methylation profiling platform, and (v) the dataset must contain “IDAT” files. Afterwards, the R package “minfi”79 was used to process the Illumina methylation 450K array data to identify the DMCs and DMRs between PC samples and adjacent tissues. “dmpFinder” function (type = categorical) of this package was utilized to identify the DMCs where significance level was set as absolute delta beta value > 0.2 (20% difference on beta value) and P-value < 0.05. The Benjamini and Hochberg technique was used to determine the false discovery rate (FDR) from multiple testing adjustments of raw P-value. “bumphunter” function (resamples = 100, cut off = 0.2) of the “minfi” package was then used to identify the DMRs. The “HM450.hg38.manifest” file (https://zwdzwd.github.io/InfiniumAnnotation) was used to perform the genomic annotation of each CpG site. According to the “HM450.hg38.manifest” and GENCODE v36 (https://www.gencodegenes.org/human/release_36.html) reference annotation file, the genomic coordinates of each lncRNA was obtained. We then combined both the information regarding the genomic coordinates of CpG sites and lncRNAs to look for the differentially methylated loci inside the promoter regions [2500 bp upstream and 1000 bp downstream from the putative transcription start site (TSS)] of lncRNAs. “qqman”80 R package was used to construct a Manhattan plot to represent the chromosomal distribution of CpG sites according to FDR. TCGA (PRAD)-450K methylation array data was retrieved from the UCSC Xena browser81 to cross-check the DNA methylation patterns of the CpG sites.
Characterization of differentially expressed lncRNAs in prostate cancer
A differential expression analysis of lncRNAs was conducted to identify the pivotal lncRNAs potentially involved in prostate cancer (PC). Concerning this, the lncRNA microarray dataset for PC was retrieved from the GEO database with the keyword “prostate cancer” while considering the following criteria for selecting the suitable datasets (i) the lncRNA dataset was restricted to “Homo sapiens”, (ii) the experiment type was specified to “non-coding RNA profiling by array”, and (iii) dataset having tumor and control samples. The dataset satisfying the aforementioned criteria was utilized for analyzing through the R package “limma”82 to identify the differentially expressed lncRNA (DElncRNA) between PC samples and control samples. FDR was computed through the Benjamini and Hochberg approach for adjusting the raw P-value to correct the occurrence of false positive results. lncRNAs showing the values of FDR < 0.05 and absolute log2FC (fold change) > 1.5 were defined as DElncRNAs. Based on the “HM450.hg38.manifest” and GENCODE v36 reference file, the genomic annotation of each lncRNA was done to figure out the DElncRNAs which contain DMCs within their promoter region and selected for further analysis. “ggplot2” R package was employed to generate a volcano plot to represent the expression pattern of lncRNAs. Moreover, “gplots” R package was used to visualize the expression profile of DElncRNA. Both the “ggplot2” and “gplots” R packages were accessed through the Galaxy server83.
Correlation analysis between DNA methylation and lncRNA expression
A correlation analysis between the lncRNA expression and the methylation of DMCs was conducted to evaluate the impact of methylation on the expression of corresponding lncRNAs and to determine the relevant significant lncRNAs involved in PC. The expression value (quantified as FPKM values) of the selected DElncRNAs from 496 PC patients were extracted from the TCGA (PRAD)-RNAseq data by utilizing the UCSC Xena Browser. UCSC Xena is a scalable solution for the visualization and analysis of cancer genomics from large public data repositories like TCGA and the GDC as well as private datasets81. Similarly, the methylation value (quantified as beta values) of the selected DMCs from the same 496 PC patients were obtained from the TCGA (PRAD)-450K methylation array data through accessing the UCSC Xena Browser. The "cor.test" function of the R programming language84 was used to assess the Spearman's correlation coefficient (R) between the expression of the selected lncRNAs and the methylation level of the corresponding DMCs where significant threshold was fixed at an absolute value of R > 0.3 and P-value < 0.05. Only negatively correlated DElncRNA-DMC pairs were considered for further analysis as methylation in promoters is negatively correlate with corresponding gene expression56.
Impact of aberrant DNA methylation and expression of DElncRNA on the clinical prognosis of prostate cancer patients
We examined the effect of aberrant methylation and expression of the identified respective CpG sites and DElncRNAs on the clinical prognosis of PC patients. Regarding this, clinical data (TCGA-PRAD) of 500 PC patients was downloaded from the GDC Data Portal85. GDC (Genomic Data Commons) is based on NCI (National Cancer Institute) generated data including genomic, proteomic, epigenomic, clinical and other uniformly processed data from The Cancer Genome Atlas (TCGA) and Therapeutically Applicable Research to Generate Effective Therapies (TARGET) programs to explore cancer research85. Initially, for each patient, we calculated the median of the expression and methylation value obtained in the previous step for the identified respective DElncRNAs and DMCs. Based on the median value the patients were then divided into low and high expression/methylation groups. Kaplan–Meier overall survival curve was generated to compare the clinical prognosis between the high and low expression subjects. Moreover, a univariate Cox regression analysis was carried out to investigate the association of the selected DElncRNAs and DMCs in the clinical prognosis of PC patients. Additionally, multivariate Cox regression analysis was also done to determine the association of the expression of these DElncRNAs with other clinical features of the patients (patients’ age and primary Gleason grade). The significance level was set at 95% CI (confidence interval) of HR (hazard ratio) ⊉ 1 and P-value < 0.05. The “survival”86 and “survminer”87 R packages was implemented for these analyses.
Functional annotation and enrichment analysis
Gene Ontology-Molecular Function (GO-MF) and Gene Set Enrichment Analysis (GSEA) were performed to point out the molecular functions and the underlying biological processes in which the selected key DElncRNAs are involved. First, the protein-coding genes modulated by these DElncRNAs were identified through characterizing the lncRNA-mRNA interaction network by using the ENCORI pan-cancer analysis platform88. The lncRNA-mRNA interaction network was constructed by the Cytoscape software89. Afterwards, the identified protein-coding genes were evaluated to figure out their molecular functions by Enrichr web server90. The R package “circlize”91 was employed to generate a chord diagram for visualizing the gene-function link. The gene set enrichment analysis was carried out by the GSEA software92 to identify the biological processes associated with these DElncRNAs. For this, the log2FC value computed by the “limma” R package was used as the ranking metric for GSEA. In this analysis the gene sets were obtained from the canonical pathways sub-collection of the C2 collection in the Molecular Signatures Database (MSigDB)93.
Supplementary Information
Acknowledgements
The authors acknowledge the Department of Biotechnology & Genetic Engineering, Noakhali Science and Technology University and Computational Biology and Chemistry lab (CBC) for providing the research facilities. The authors also thank Asif Ar Rahman, Sumaiya Afroz, Zawad Arifuzzaman Uday, Rabia Jahan Tarin, Abrar Hossain Chowdhury, Sadia Hossain Jeba, and Syeda Tashfia Tabassum, Department of Biotechnology & Genetic Engineering, Noakhali Science and Technology University, for their support on data pre-processing.
Author contributions
M.I.Q.T. and M.S.H. developed the hypothesis. M.I.Q.T., M.S.H., and A.F. performed the study. M.I.Q.T., A.F., I.H., K.K., and H.A.R. wrote the manuscript. M.S.H. and N.M.B. reviewed the manuscript. All authors approved the manuscript.
Data availability
The datasets generated during and/or analyzed during the current study are available from the corresponding author on reasonable request.
Competing interests
The authors declare no competing interests.
Footnotes
Publisher's note
Springer Nature remains neutral with regard to jurisdictional claims in published maps and institutional affiliations.
Supplementary Information
The online version contains supplementary material available at 10.1038/s41598-022-13381-0.
References
- 1.Bray F, et al. Global cancer statistics 2018: GLOBOCAN estimates of incidence and mortality worldwide for 36 cancers in 185 countries. CA Cancer J. Clin. 2018;68:394–424. doi: 10.3322/caac.21492. [DOI] [PubMed] [Google Scholar]
- 2.Rawla P. Epidemiology of prostate cancer. World J. Oncol. 2019;10:63. doi: 10.14740/wjon1191. [DOI] [PMC free article] [PubMed] [Google Scholar]
- 3.Albertsen PC, Hanley JA, Fine J. 20-year outcomes following conservative management of clinically localized prostate cancer. JAMA. 2005;293:2095–2101. doi: 10.1001/jama.293.17.2095. [DOI] [PubMed] [Google Scholar]
- 4.Taylor BS, et al. Integrative genomic profiling of human prostate cancer. Cancer Cell. 2010;18:11–22. doi: 10.1016/j.ccr.2010.05.026. [DOI] [PMC free article] [PubMed] [Google Scholar]
- 5.King JC, et al. Cooperativity of TMPRSS2-ERG with PI3-kinase pathway activation in prostate oncogenesis. Nat. Genet. 2009;41:524–526. doi: 10.1038/ng.371. [DOI] [PMC free article] [PubMed] [Google Scholar]
- 6.Lapointe J, et al. Gene expression profiling identifies clinically relevant subtypes of prostate cancer. Proc. Natl. Acad. Sci. 2004;101:811–816. doi: 10.1073/pnas.0304146101. [DOI] [PMC free article] [PubMed] [Google Scholar]
- 7.Pflueger D, et al. Discovery of non-ETS gene fusions in human prostate cancer using next-generation RNA sequencing. Genome Res. 2011;21:56–67. doi: 10.1101/gr.110684.110. [DOI] [PMC free article] [PubMed] [Google Scholar]
- 8.Robbins CM, et al. Copy number and targeted mutational analysis reveals novel somatic events in metastatic prostate tumors. Genome Res. 2011;21:47–55. doi: 10.1101/gr.107961.110. [DOI] [PMC free article] [PubMed] [Google Scholar]
- 9.Sboner A, et al. Molecular sampling of prostate cancer: a dilemma for predicting disease progression. BMC Med. Genomics. 2010;3:1–12. doi: 10.1186/1755-8794-3-8. [DOI] [PMC free article] [PubMed] [Google Scholar]
- 10.Singh D, et al. Gene expression correlates of clinical prostate cancer behavior. Cancer Cell. 2002;1:203–209. doi: 10.1016/S1535-6108(02)00030-2. [DOI] [PubMed] [Google Scholar]
- 11.Tomlins SA, et al. Recurrent fusion of TMPRSS2 and ETS transcription factor genes in prostate cancer. Science. 2005;310:644–648. doi: 10.1126/science.1117679. [DOI] [PubMed] [Google Scholar]
- 12.Tomlins SA, et al. The role of SPINK1 in ETS rearrangement-negative prostate cancers. Cancer Cell. 2008;13:519–528. doi: 10.1016/j.ccr.2008.04.016. [DOI] [PMC free article] [PubMed] [Google Scholar]
- 13.Kobayashi Y, et al. DNA methylation profiling reveals novel biomarkers and important roles for DNA methyltransferases in prostate cancer. Genome Res. 2011;21:1017–1027. doi: 10.1101/gr.119487.110. [DOI] [PMC free article] [PubMed] [Google Scholar]
- 14.Massie CE, Mills IG, Lynch AG. The importance of DNA methylation in prostate cancer development. J. Steroid Biochem. Mol. Biol. 2017;166:1–15. doi: 10.1016/j.jsbmb.2016.04.009. [DOI] [PubMed] [Google Scholar]
- 15.Li E, Bestor TH, Jaenisch R. Targeted mutation of the DNA methyltransferase gene results in embryonic lethality. Cell. 1992;69:915–926. doi: 10.1016/0092-8674(92)90611-F. [DOI] [PubMed] [Google Scholar]
- 16.Das PM, Singal R. DNA methylation and cancer. J. Clin. Oncol. 2004;22:4632–4642. doi: 10.1200/JCO.2004.07.151. [DOI] [PubMed] [Google Scholar]
- 17.Ehrlich M. DNA methylation in cancer: Too much, but also too little. Oncogene. 2002;21:5400–5413. doi: 10.1038/sj.onc.1205651. [DOI] [PubMed] [Google Scholar]
- 18.Esteller M, Herman JG. Cancer as an epigenetic disease: DNA methylation and chromatin alterations in human tumours. J. Pathol. 2002;196:1–7. doi: 10.1002/path.1024. [DOI] [PubMed] [Google Scholar]
- 19.Jones PA. DNA methylation and cancer. Cancer Res. 1986;46:461–466. [PubMed] [Google Scholar]
- 20.Laird PW, Jaenisch R. DNA methylation and cancer. Hum. Mol. Genet. 1994;3:1487–1495. doi: 10.1093/hmg/3.suppl_1.1487. [DOI] [PubMed] [Google Scholar]
- 21.Laird PW, Jaenisch R. The role of DNA methylation in cancer genetics and epigenetics. Annu. Rev. Genet. 1996;30:441–464. doi: 10.1146/annurev.genet.30.1.441. [DOI] [PubMed] [Google Scholar]
- 22.Patra SK, Patra A, Zhao H, Dahiya R. DNA methyltransferase and demethylase in human prostate cancer. Mol. Carcinog. 2002;33:163–171. doi: 10.1002/mc.10033. [DOI] [PubMed] [Google Scholar]
- 23.Friedlander TW, et al. Common structural and epigenetic changes in the genome of castration-resistant prostate cancer. Can. Res. 2012;72:616–625. doi: 10.1158/0008-5472.CAN-11-2079. [DOI] [PubMed] [Google Scholar]
- 24.Lee W-H, Isaacs WB, Bova GS, Nelson WG. CG island methylation changes near the GSTP1 gene in prostatic carcinoma cells detected using the polymerase chain reaction: A new prostate cancer biomarker. Cancer Epidemiol. Prev. Biomarkers. 1997;6:443–450. [PubMed] [Google Scholar]
- 25.Illingworth RS, Bird AP. CpG islands—‘a rough guide’. FEBS Lett. 2009;583:1713–1720. doi: 10.1016/j.febslet.2009.04.012. [DOI] [PubMed] [Google Scholar]
- 26.Bird A. DNA methylation patterns and epigenetic memory. Genes Dev. 2002;16:6–21. doi: 10.1101/gad.947102. [DOI] [PubMed] [Google Scholar]
- 27.Jones PA, Baylin SB. The epigenomics of cancer. Cell. 2007;128:683–692. doi: 10.1016/j.cell.2007.01.029. [DOI] [PMC free article] [PubMed] [Google Scholar]
- 28.Jones PA. Functions of DNA methylation: Islands, start sites, gene bodies and beyond. Nat. Rev. Genet. 2012;13:484–492. doi: 10.1038/nrg3230. [DOI] [PubMed] [Google Scholar]
- 29.Song P, Wu L, Guan W. Genome-wide identification and characterization of DNA methylation and long non-coding RNA expression in gastric cancer. Front. Genet. 2020;11:91. doi: 10.3389/fgene.2020.00091. [DOI] [PMC free article] [PubMed] [Google Scholar]
- 30.Mercer TR, Dinger ME, Mattick JS. Long non-coding RNAs: Insights into functions. Nat. Rev. Genet. 2009;10:155–159. doi: 10.1038/nrg2521. [DOI] [PubMed] [Google Scholar]
- 31.Moran VA, Perera RJ, Khalil AM. Emerging functional and mechanistic paradigms of mammalian long non-coding RNAs. Nucleic Acids Res. 2012;40:6391–6400. doi: 10.1093/nar/gks296. [DOI] [PMC free article] [PubMed] [Google Scholar]
- 32.Costa FF. Non-coding RNAs: Meet thy masters. BioEssays. 2010;32:599–608. doi: 10.1002/bies.200900112. [DOI] [PubMed] [Google Scholar]
- 33.Huarte M, Rinn JL. Large non-coding RNAs: missing links in cancer? Hum. Mol. Genet. 2010;19:R152–R161. doi: 10.1093/hmg/ddq353. [DOI] [PMC free article] [PubMed] [Google Scholar]
- 34.Spizzo R, Almeida MIE, Colombatti A, Calin GA. Long non-coding RNAs and cancer: A new frontier of translational research? Oncogene. 2012;31:4577–4587. doi: 10.1038/onc.2011.621. [DOI] [PMC free article] [PubMed] [Google Scholar]
- 35.Huarte M. The emerging role of lncRNAs in cancer. Nat. Med. 2015;21:1253–1261. doi: 10.1038/nm.3981. [DOI] [PubMed] [Google Scholar]
- 36.Nahand JS, et al. microRNAs: new prognostic, diagnostic, and therapeutic biomarkers in cervical cancer. J. Cell. Physiol. 2019;234:17064–17099. doi: 10.1002/jcp.28457. [DOI] [PubMed] [Google Scholar]
- 37.Lan, H., Lu, H., Wang, X. & Jin, H. MicroRNAs as potential biomarkers in cancer: opportunities and challenges. BioMed Res. Int.2015 (2015). [DOI] [PMC free article] [PubMed]
- 38.Asakura K, et al. A miRNA-based diagnostic model predicts resectable lung cancer in humans with high accuracy. Commun. Biol. 2020;3:1–9. doi: 10.1038/s42003-020-0863-y. [DOI] [PMC free article] [PubMed] [Google Scholar]
- 39.Hossain MS, et al. MicroRNAs expression analysis shows key affirmation of Synaptopodin-2 as a novel prognostic and therapeutic biomarker for colorectal and Cervical cancers. Heliyon. 2021;7:e07347. doi: 10.1016/j.heliyon.2021.e07347. [DOI] [PMC free article] [PubMed] [Google Scholar]
- 40.Kar K, et al. Prediction of novel miRNA biomarker candidates for diagnostic and prognostic analysis of STAD and LIHC: An integrated in silico approach. Inform. Med. Unlocked. 2021;24:100581. doi: 10.1016/j.imu.2021.100581. [DOI] [Google Scholar]
- 41.Zhou M, et al. Identification and validation of potential prognostic lncRNA biomarkers for predicting survival in patients with multiple myeloma. J. Exp. Clin. Cancer Res. 2015;34:1–14. doi: 10.1186/s13046-014-0119-0. [DOI] [PMC free article] [PubMed] [Google Scholar]
- 42.Zhou M, et al. Discovery and validation of immune-associated long non-coding RNA biomarkers associated with clinically molecular subtype and prognosis in diffuse large B cell lymphoma. Mol. Cancer. 2017;16:1–13. doi: 10.1186/s12943-017-0580-4. [DOI] [PMC free article] [PubMed] [Google Scholar]
- 43.Xue Y, et al. Association between lncrna PCGEM1 polymorphisms and prostate cancer risk. Prostate Cancer Prostatic Dis. 2013;16:139–144. doi: 10.1038/pcan.2013.6. [DOI] [PubMed] [Google Scholar]
- 44.Brooks JD, et al. CG island methylation changes near the GSTP1 gene in prostatic intraepithelial neoplasia. Cancer Epidemiol. Prev. Biomarkers. 1998;7:531–536. [PubMed] [Google Scholar]
- 45.Jerónimo C, Henrique R, Hoque MO, Mambo E, Ribeiro FR, Varzim G, Oliveira J, Teixeira MR, Lopes C, Sidransky D. A quantitative promoter methylation profile of prostate cancer. Clin. Cancer Res. 2004;10:8472–8478. doi: 10.1158/1078-0432.CCR-04-0894. [DOI] [PubMed] [Google Scholar]
- 46.Kron K, et al. Discovery of novel hypermethylated genes in prostate cancer using genomic CpG island microarrays. PLoS ONE. 2009;4:e4830. doi: 10.1371/journal.pone.0004830. [DOI] [PMC free article] [PubMed] [Google Scholar]
- 47.Li L-C, Carroll PR, Dahiya R. Epigenetic changes in prostate cancer: Implication for diagnosis and treatment. J. Natl Cancer Inst. 2005;97:103–115. doi: 10.1093/jnci/dji010. [DOI] [PubMed] [Google Scholar]
- 48.Gibb EA, Brown CJ, Lam WL. The functional role of long non-coding RNA in human carcinomas. Mol. Cancer. 2011;10:1–17. doi: 10.1186/1476-4598-10-38. [DOI] [PMC free article] [PubMed] [Google Scholar]
- 49.Qi P, Du X. The long non-coding RNAs, a new cancer diagnostic and therapeutic gold mine. Mod. Pathol. 2013;26:155–165. doi: 10.1038/modpathol.2012.160. [DOI] [PubMed] [Google Scholar]
- 50.Bolha, L., Ravnik-Glavač, M. & Glavač, D. Long noncoding RNAs as biomarkers in cancer. Dis. Markers2017 (2017). [DOI] [PMC free article] [PubMed]
- 51.Sun T, Ye H, Wu C-L, Lee G-SM, Kantoff PW. Emerging players in prostate cancer: Long non-coding RNAs. Am. J. Clin. Exp. Urol. 2014;2:294. [PMC free article] [PubMed] [Google Scholar]
- 52.Aird J, et al. Carcinogenesis in prostate cancer: The role of long non-coding RNAs. Non-coding RNA Res. 2018;3:29–38. doi: 10.1016/j.ncrna.2018.01.001. [DOI] [PMC free article] [PubMed] [Google Scholar]
- 53.Heilmann K, et al. Genome-wide screen for differentially methylated long noncoding RNAs identifies Esrp2 and lncRNA Esrp2-as regulated by enhancer DNA methylation with prognostic relevance for human breast cancer. Oncogene. 2017;36:6446–6461. doi: 10.1038/onc.2017.246. [DOI] [PMC free article] [PubMed] [Google Scholar]
- 54.Tang, B. Inference of crosstalk effects between DNA methylation and lncRNA regulation in NSCLC. BioMed Res. Int.2018 (2018). [DOI] [PMC free article] [PubMed]
- 55.Bao S, et al. Computational identification of mutator-derived lncRNA signatures of genome instability for improving the clinical outcome of cancers: A case study in breast cancer. Brief. Bioinform. 2020;21:1742–1755. doi: 10.1093/bib/bbz118. [DOI] [PubMed] [Google Scholar]
- 56.Mosquera Orgueira A. Hidden among the crowd: Differential DNA methylation-expression correlations in cancer occur at important oncogenic pathways. Front. Genet. 2015;6:163. doi: 10.3389/fgene.2015.00163. [DOI] [PMC free article] [PubMed] [Google Scholar]
- 57.Yu P, Kang A, Jing L, Wang Y. Long non-coding RNA CACNA1G-AS1 promotes cell migration, invasion and epithelial–mesenchymal transition by HNRNPA2B1 in non-small cell lung cancer. Eur. Rev. Med. Pharmacol. Sci. 2018;22:993–1002. doi: 10.26355/eurrev_201802_14381. [DOI] [PubMed] [Google Scholar]
- 58.Zheng J, Guo J, Cao B, Zhou Y, Tong J. Identification and validation of lncRNAs involved in m6A regulation for patients with ovarian cancer. Cancer Cell Int. 2021;21:1–18. doi: 10.1186/s12935-020-01646-5. [DOI] [PMC free article] [PubMed] [Google Scholar]
- 59.Tang J, et al. Wilms’ tumor 1-associating protein promotes renal cell carcinoma proliferation by regulating CDK2 mRNA stability. J. Exp. Clin. Cancer Res. 2018;37:1–12. doi: 10.1186/s13046-017-0664-4. [DOI] [PMC free article] [PubMed] [Google Scholar]
- 60.Bansal H, et al. WTAP is a novel oncogenic protein in acute myeloid leukemia. Leukemia. 2014;28:1171–1174. doi: 10.1038/leu.2014.16. [DOI] [PMC free article] [PubMed] [Google Scholar]
- 61.Kuai Y, et al. Wilms’ tumor 1-associating protein plays an aggressive role in diffuse large B-cell lymphoma and forms a complex with BCL6 via Hsp90. Cell Commun. Signal. 2018;16:1–11. doi: 10.1186/s12964-018-0258-6. [DOI] [PMC free article] [PubMed] [Google Scholar]
- 62.Jo H-J, et al. WTAP regulates migration and invasion of cholangiocarcinoma cells. J. Gastroenterol. 2013;48:1271–1282. doi: 10.1007/s00535-013-0748-7. [DOI] [PubMed] [Google Scholar]
- 63.Chen Y, et al. WTAP facilitates progression of hepatocellular carcinoma via m6A-HuR-dependent epigenetic silencing of ETS1. Mol. Cancer. 2019;18:1–19. doi: 10.1186/s12943-018-0930-x. [DOI] [PMC free article] [PubMed] [Google Scholar]
- 64.Huang L, et al. Long non-coding RNA NNT-AS1 functions as an oncogenic gene through modulating miR-485/BCL9 in cholangiocarcinoma. Cancer Manag. Res. 2019;11:7739. doi: 10.2147/CMAR.S207801. [DOI] [PMC free article] [PubMed] [Google Scholar]
- 65.Ye H, et al. Overexpression of long non-coding RNA NNT-AS1 correlates with tumor progression and poor prognosis in osteosarcoma. Cell. Physiol. Biochem. 2018;45:1904–1914. doi: 10.1159/000487966. [DOI] [PubMed] [Google Scholar]
- 66.Shen Q, Jiang Y. LncRNA NNT-AS1 promotes the proliferation, and invasion of lung cancer cells via regulating miR-129-5p expression. Biomed. Pharmacother. 2018;105:176–181. doi: 10.1016/j.biopha.2018.05.123. [DOI] [PubMed] [Google Scholar]
- 67.Yin H, Hu J, Ye Z, Chen S, Chen Y. Serum long non-coding RNA NNT-AS1 protected by exosome is a potential biomarker and functions as an oncogene via the miR-496/RAP2C axis in colorectal cancer. Mol. Med. Rep. 2021;24:1–11. doi: 10.3892/mmr.2021.12224. [DOI] [PMC free article] [PubMed] [Google Scholar]
- 68.Yao C, et al. NNT-AS1 modulates prostate cancer cell proliferation, apoptosis and migration through miR-496/DDIT4 axis. Cancer Cell Int. 2020;20:1–11. doi: 10.1186/s12935-019-1086-5. [DOI] [PMC free article] [PubMed] [Google Scholar]
- 69.Yin Y, et al. Histone deacetylase 3 overexpression in human cholangiocarcinoma and promotion of cell growth via apoptosis inhibition. Cell Death Dis. 2017;8:e2856. doi: 10.1038/cddis.2016.457. [DOI] [PMC free article] [PubMed] [Google Scholar]
- 70.Xu G, Zhu H, Zhang M, Xu J. Histone deacetylase 3 is associated with gastric cancer cell growth via the miR-454-mediated targeting of CHD5. Int. J. Mol. Med. 2018;41:155–163. doi: 10.3892/ijmm.2017.3225. [DOI] [PMC free article] [PubMed] [Google Scholar]
- 71.Du J, et al. Lncrna f11-as1 suppresses liver hepatocellular carcinoma progression by competitively binding with mir-3146 to regulate pten expression. J. Cell. Biochem. 2019;120:18457–18464. doi: 10.1002/jcb.29163. [DOI] [PubMed] [Google Scholar]
- 72.Deng Y, et al. Long non-coding RNA F11-AS1 inhibits HBV-related hepatocellular carcinoma progression by regulating NR1I3 via binding to microRNA-211-5p. J. Cell Mol. Med. 2020;24:1848–1865. doi: 10.1111/jcmm.14881. [DOI] [PMC free article] [PubMed] [Google Scholar]
- 73.Motiwala T, Jacob ST. Role of protein tyrosine phosphatases in cancer. Prog. Nucleic Acid Res. Mol. Biol. 2006;81:297–329. doi: 10.1016/S0079-6603(06)81008-1. [DOI] [PMC free article] [PubMed] [Google Scholar]
- 74.Jeanes A, Gottardi C, Yap A. Cadherins and cancer: How does cadherin dysfunction promote tumor progression? Oncogene. 2008;27:6920–6929. doi: 10.1038/onc.2008.343. [DOI] [PMC free article] [PubMed] [Google Scholar]
- 75.Srinivasan S, et al. Disruption of cytochrome c oxidase function induces the Warburg effect and metabolic reprogramming. Oncogene. 2016;35:1585–1595. doi: 10.1038/onc.2015.227. [DOI] [PMC free article] [PubMed] [Google Scholar]
- 76.de la Parra C, Walters BA, Geter P, Schneider RJ. Translation initiation factors and their relevance in cancer. Curr. Opin. Genet. Dev. 2018;48:82–88. doi: 10.1016/j.gde.2017.11.001. [DOI] [PMC free article] [PubMed] [Google Scholar]
- 77.Cicenas J, Zalyte E, Bairoch A, Gaudet P. Kinases and cancer. Cancers. 2018 doi: 10.3390/cancers10030063. [DOI] [PMC free article] [PubMed] [Google Scholar]
- 78.Barrett T, et al. NCBI GEO: Mining millions of expression profiles—database and tools. Nucleic Acids Res. 2005;33:D562–D566. doi: 10.1093/nar/gki022. [DOI] [PMC free article] [PubMed] [Google Scholar]
- 79.Aryee MJ, et al. Minfi: A flexible and comprehensive Bioconductor package for the analysis of Infinium DNA methylation microarrays. Bioinformatics. 2014;30:1363–1369. doi: 10.1093/bioinformatics/btu049. [DOI] [PMC free article] [PubMed] [Google Scholar]
- 80.Turner, S. D. qqman: An R package for visualizing GWAS results using QQ and manhattan plots. Biorxiv, 005165 (2014).
- 81.Goldman MJ, et al. Visualizing and interpreting cancer genomics data via the Xena platform. Nat. Biotechnol. 2020;38:675–678. doi: 10.1038/s41587-020-0546-8. [DOI] [PMC free article] [PubMed] [Google Scholar]
- 82.Ritchie ME, et al. limma powers differential expression analyses for RNA-sequencing and microarray studies. Nucleic Acids Res. 2015;43:e47–e47. doi: 10.1093/nar/gkv007. [DOI] [PMC free article] [PubMed] [Google Scholar]
- 83.Jalili V, et al. The Galaxy platform for accessible, reproducible and collaborative biomedical analyses: 2020 update. Nucleic Acids Res. 2020;48:W395–W402. doi: 10.1093/nar/gkaa434. [DOI] [PMC free article] [PubMed] [Google Scholar]
- 84.Team, R. C. R: A Language and Environment for Statistical Computing. (2013).
- 85.Grossman RL, et al. Toward a shared vision for cancer genomic data. N. Engl. J. Med. 2016;375:1109–1112. doi: 10.1056/NEJMp1607591. [DOI] [PMC free article] [PubMed] [Google Scholar]
- 86.Lin, H. & Zelterman, D. (Taylor & Francis, 2002).
- 87.Kassambara, A., Kosinski, M., Biecek, P. & Fabian, S. Package ‘survminer’. Drawing Survival Curves using ‘ggplot2’(R package version 03 1) (2017).
- 88.Li J-H, Liu S, Zhou H, Qu L-H, Yang J-H. starBase v2.0: Decoding miRNA-ceRNA, miRNA-ncRNA and protein–RNA interaction networks from large-scale CLIP-Seq data. Nucl. Acids Res. 2014;42:D92–D97. doi: 10.1093/nar/gkt1248. [DOI] [PMC free article] [PubMed] [Google Scholar]
- 89.Shannon P, et al. Cytoscape: A software environment for integrated models of biomolecular interaction networks. Genome Res. 2003;13:2498–2504. doi: 10.1101/gr.1239303. [DOI] [PMC free article] [PubMed] [Google Scholar]
- 90.Kuleshov MV, et al. Enrichr: A comprehensive gene set enrichment analysis web server 2016 update. Nucleic Acids Res. 2016;44:W90–W97. doi: 10.1093/nar/gkw377. [DOI] [PMC free article] [PubMed] [Google Scholar]
- 91.Gu Z, Gu L, Eils R, Schlesner M, Brors B. circlize implements and enhances circular visualization in R. Bioinformatics. 2014;30:2811–2812. doi: 10.1093/bioinformatics/btu393. [DOI] [PubMed] [Google Scholar]
- 92.Subramanian A, et al. Gene set enrichment analysis: A knowledge-based approach for interpreting genome-wide expression profiles. Proc. Natl. Acad. Sci. 2005;102:15545–15550. doi: 10.1073/pnas.0506580102. [DOI] [PMC free article] [PubMed] [Google Scholar]
- 93.Liberzon A, et al. Molecular signatures database (MSigDB) 3.0. Bioinformatics. 2011;27:1739–1740. doi: 10.1093/bioinformatics/btr260. [DOI] [PMC free article] [PubMed] [Google Scholar]
Associated Data
This section collects any data citations, data availability statements, or supplementary materials included in this article.
Supplementary Materials
Data Availability Statement
The datasets generated during and/or analyzed during the current study are available from the corresponding author on reasonable request.


