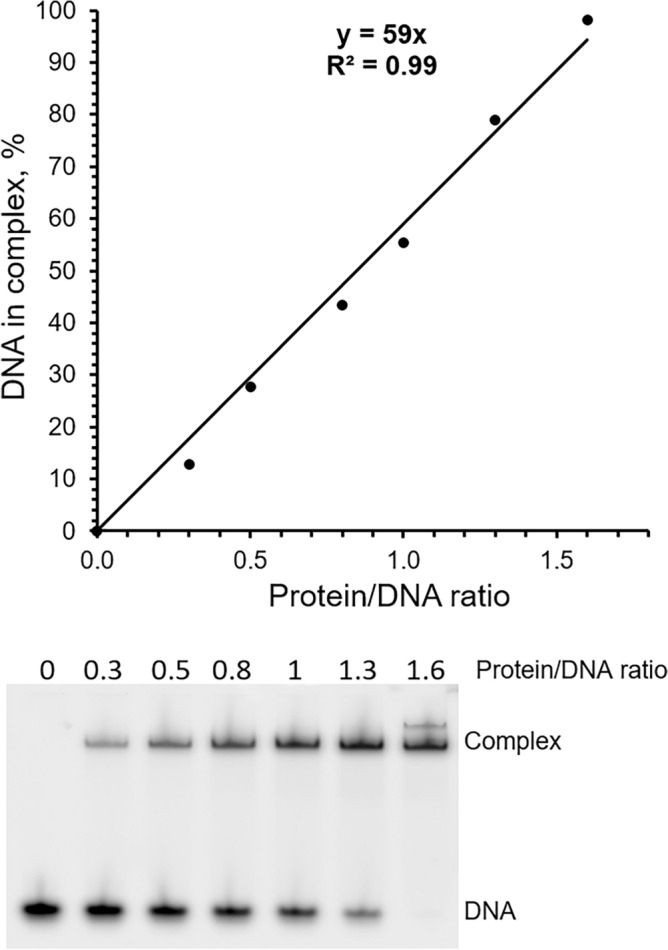
Figure 1.

Estimation of the level of active molecules by EMSA. The Cy3-labeled DNA (0.5 µM) was incubated with varying amounts of hPolεCD. Samples were separated by electrophoresis in 5% acrylamide gel and visualized by Typhoon FLA 9500. The percentage of DNA in the complex is plotted against the protein/DNA ratio, and the generated trend line shows the percentage of active molecules capable of DNA binding. The result of one representative experiment is shown.
