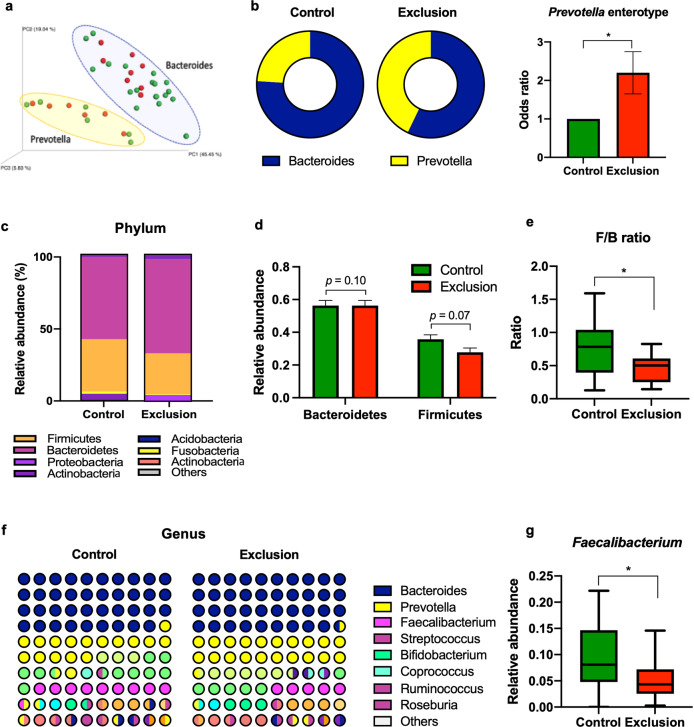
Fig. 1. Gut microbiota profiling in individuals with and without social exclusion experience.
a Principal Coordinate Analysis (PCA) plot of microbiome samples from the control and exclusion groups. b Pie charts showing the percentage of Bacteroides or Prevotella spp. in the samples from the control and exclusion groups. The bar graph shows odds ratios and the 95% confidence interval for the probability of having Prevotella-enriched enterotype in the exclusion group compared to the control group. c Relative abundance (%) of the phyla in the two groups of participants shown as a stacked bar graph. d Relative abundance of the two most abundant phyla Bacteroidetes and Firmicutes shown as a bar graph. e The ratio of Firmicutes to Bacteroidetes shown as a box-and-whisker plot. f Relative abundance of bacteria at the genus level in the control and exclusion groups shown as a dot plot matrix. g Relative abundance of the genus Faecalibacterium shown as a box-and-whisker plot. The lowest and highest points in a box-and-whisker plot correspond to the minimum and maximum of the data set, respectively, and the horizontal line in the middle indicates the mean value. *P < 0.05 according to t-test.

