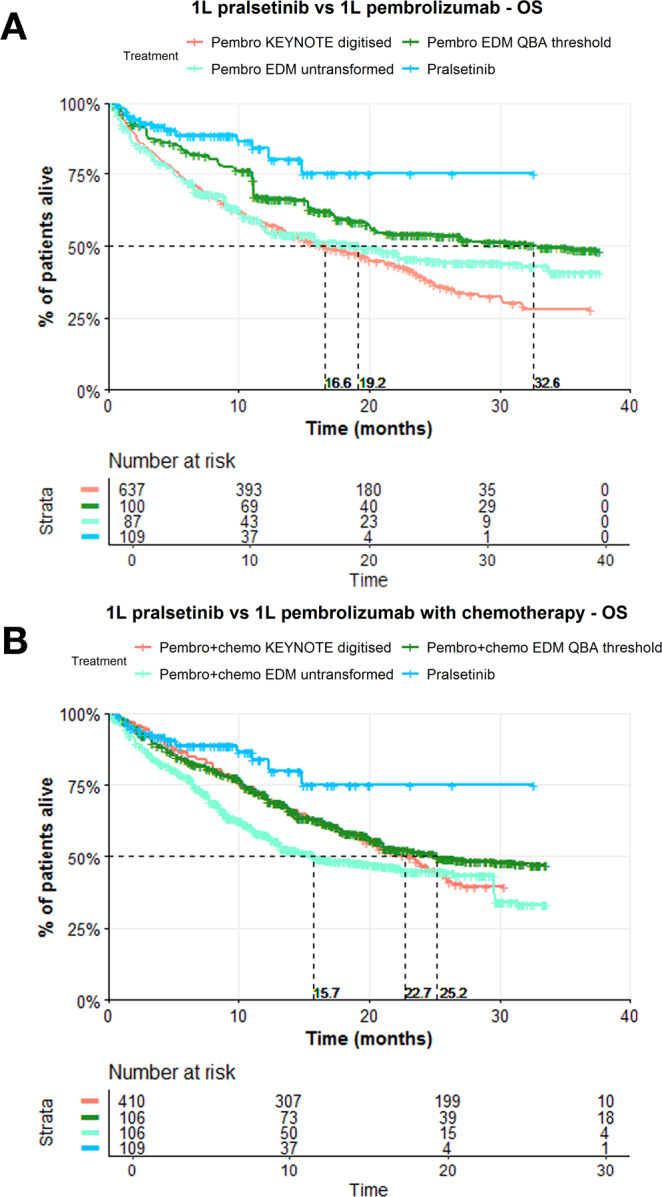
Fig. 3. Kaplan–Meier curves for OS showing the robustness of the estimated hazard ratios for the comparison between 1 L pralsetinib trial cohort and 1 L pembrolizumab cohort, and 1 L pralsetinib trial cohort and 1 L pembrolizumab with chemotherapy cohort when the RWD cohorts are transformed to have increased OS.

A The Kaplan–Meier curves for OS correspond to the comparison between 1 L pralsetinib versus 1 L pembrolizumab (N = 637 for the digitised KEYNOTE cohort, ESS = 109 for the pralsetinib cohort, ESS = 115 for the pembrolizumab cohort when untransformed and at the transformation threshold), and B corresponds to the comparison between 1 L pralsetinib versus 1 L pembrolizumab with chemotherapy (N = 410 for the digitised KEYNOTE cohort, ESS = 109 for the pralsetinib cohort, ESS = 217 for the pembrolizumab with chemotherapy cohort when untransformed and at the transformation threshold) after QBA of the HRs; red indicates the digitised curve from the corresponding KEYNOTE trial (KEYNOTE-42 for pembrolizumab and KEYNOTE-189 for pembrolizumab with chemotherapy), light green indicates the untransformed weighted KM curve for the EDM cohort, dark green is the weighted KM curve for the EDM at the transformation threshold where the adjusted HR remains significant, and blue indicates the pralsetinib group’s weighted KM curve.
