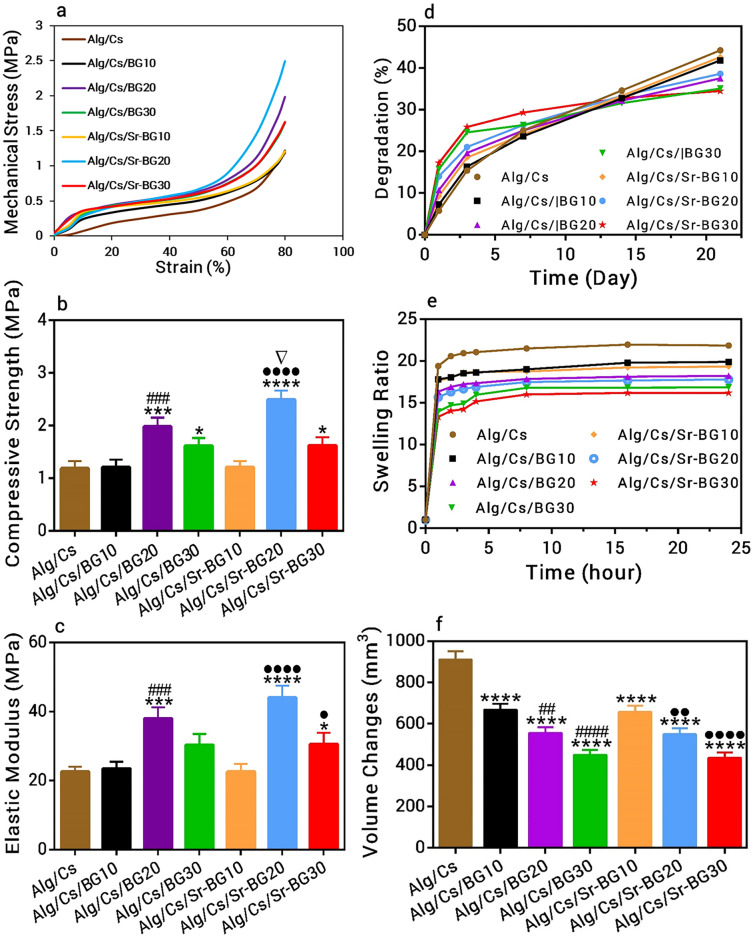
Figure 6.
Mechanical test, degradation and swelling profile of scaffolds. (a) Stress–strain curve, (b) Compressive strength, (c) Elastic Modules, (d) Degradation profile, (e) Swelling profile and (f) Volume changes during swelling. Significant difference with Alg/Cs group at p < 0.05 (*), p < 0.001 (***), p < 0.0001 (****). Significant difference with Alg/Cs/BG10 group at p < 0.01 (##), p < 0.001 (###), p < 0.0001 (####). Significant difference with Alg/Cs/Sr-BG10 group at p < 0.05 (·), p < 0.01 (··), p < 0.0001 (····). Significant difference between Alg/Cs/BG and Alg/Cs/Sr-BG groups at p < 0.05 (⛛).

