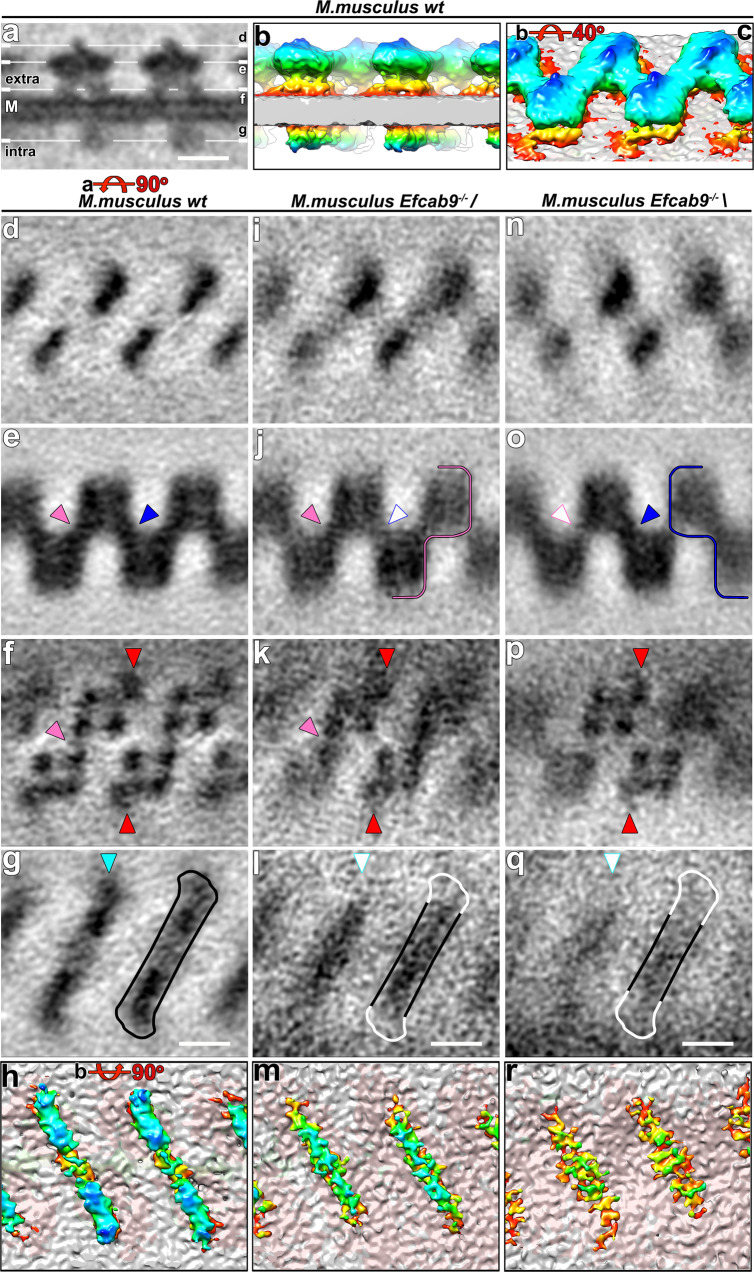
Fig. 3. Structural features of the 3D averaged CatSper complex.
a A tomographic slice showing the side view of averaged CatSper complex structure in wild type mouse sperm. M, membrane. b, c 3D isosurface renderings of the averaged CatSper complex in wild type mouse sperm: (b) side view; (c) extracellular domain. d–g, i–l, n–q Tomographic slices showing the averaged CatSper complex structure of wild type (d–g) and Efcab9−/− (/, i–l; \, n–q) mouse sperm in top view. The positions are indicated by lines in (a) showing the following structural features (roof ridge: d, i, n; canopy roof: e, j, o; tetrameric channel pore: f, k, p; intracellular domain: g, l, q). The filled pink and blue arrowheads in (e, j, o) indicate the presence of electron density between adjacent CatSper complexes, which are weakened in Efcab9−/− as indicated by white arrowheads in (j, o). In (f, k, p) red arrowheads indicate the wing structures, and pink arrowheads highlight an inner connection close to the channel subunits. The filled cyan arrowhead in (g) indicates the position of the EFCAB9-CATSPERζ subcomplex, which is missing in Efcab9−/− flagella (white arrowheads in l and q). h, m, r 3D isosurface renderings show bottom views of the averaged CatSper intracellular domain in wild type (h) and Efcab9−/− (/, m; \, r) flagella. Scale bars, 10 nm.

